Budgeting as a management technology is characterized by the fact that almost all departments of the enterprise are involved in it (and very actively). This imposes special requirements on the budgeting automation platform: it must have such qualities as simplicity, versatility, flexibility, protection from user errors, etc. At the same time, it must be integrated with the management accounting system and the treasury system so that the control and analytical functions of budgets are also implemented at the required level. Fortunately, using Excel allows you to organize budgeting in exactly this way, without unnecessary labor and financial costs. We will tell you how to achieve this result in our webinar.
Using Excel as a budgeting automation platform seems even more justified than automating management accounting and reporting. Excel is, in fact, an ideal platform for budgeting due to the fact that it is very easy to customize to the specifics of almost any enterprise, regardless of its industry, size and organizational structure. At the webinar, the speaker will discuss the main approaches to budgeting automation that can be used in almost any company. Here are the main topics planned to be discussed at the webinar:
- How to organize your budgeting automation process using Excel
- How to form budgets for the Central Federal District and organize exchanges with the leaders of the Central Federal District
- How to consolidate the budgets of the Central Federal District into the company budget
- How to include the possibility of scenario planning in budgets
- How to organize storage of different versions of the budget
- How to form BDDS, BDR and planned balance
- How to link budgets with management accounting
- How to organize a plan-fact analysis of budget execution
You can register to participate in the webinar on the webinar page on the website of the Financial Director magazine.
Webinar materials:
Answers to questions from webinar participants
Question: Is it possible to organize everything using pivot tables?
Answer: Theoretically, it is possible, but pivot tables have a rigid structure, so a model built on their basis will have limited functionality. Using the SUMIFS function gives more flexibility and functionality to the budget and accounting model
Question: How to build a sales budget for small manufacturing enterprises when the enterprise works on orders, and it is difficult to predict them for the year? Order information is available only within 1-3 months. Any tips?
Answer: I would rely on statistics from last year, adjusted for the actual sales growth achieved in the first 2-3 months of this year compared to the same period last year. You should not strive to build a budget only on the basis of 100% information about future sales; the budget should contain an element of forecasting, based on extrapolation of observed trends.
Question: How can you implement a budgeting system in retail trade?
Answer: From a budgeting point of view, retail trade is no fundamentally different from other industries; its main nuance is the absence of clearly identified buyers; retail works with an impersonal mass of individuals. Therefore, sales should be budgeted not by clients, but by product groups and points of sale. Otherwise, everything is standard.
Question: How is data entered into the consolidated register? Where is the connection?
Answer: Data is loaded into the consolidated register of planned transactions using the UpdateRegistry macro. Only the registers of the Central Federal District are filled out by hand.
Question: Can you explain the issues of transfer pricing between divisions in the enterprise? To whom will the services of specialists from the planning and economic department be billed, and from whom will the income be received?
Answer: All central federal districts under such a scheme must finance the costs of the administrative and managerial apparatus, which includes the planning and economic department, through the purchase of its services.
Question: Who edits the budget: can the financial department or a department employee make changes independently?
Answer: The budget of the Central Federal District is edited by the Central Federal District itself. In the process of approving the budget of the Central Federal District, it can be adjusted both by a designated employee of the Central Federal District and by employees of the financial department, it depends on how you write this procedure in the budgeting regulations.
Question: And how can I see who made the change?
Answer: This cannot be done using standard Excel tools, although you can use macros to organize user authorization. However, I don’t see much sense in this, since with the correct organization of the budgeting process it is always clear who formed and adjusted the budget, since at each stage of this process a specific responsible person must be allocated.
Question: How can you organize budget adjustments throughout the year? At the same time, in those months when there is no adjustment, the original data was displayed.
Answer: Through the versioning tool, which was discussed in detail in the webinar. This is exactly why this tool was implemented.
Question: Is the fact only manually entered and then combined with a file with planned data?
Answer: The fact is not entered manually, but is loaded from 1C using a loader, the operation of which was discussed in detail at the webinar on automation of management accounting and reporting in Excel. Further, as you rightly noted, these data are compared with the plan.
Question: Is it possible to take into account budget versioning in plan-factual analysis?
Answer: Of course, to do this, it is enough to slightly adjust the SUMIFS formula on the “Plan-fact” sheet so that it extracts planned data taking into account versions.
Question: How to track changes day by day within the plan-fact framework? Is everything done by hand?
Answer: No, you can make a “Plan-Act” sheet broken down not by month, as was shown in the example, but by week or even by day. This is achieved by minimal adjustments to the SUMIFS function.
Question: How is the BDDS and BDR of the Central Federal District linked/filled out?
Answer: In the register of planned operations of the Central Federal District, two fields must be provided, “Accrual date” and “Payment date”. This will make it possible to record transactions for both the BDDS and the BDR within one register.
Question: How much data can Excel handle without freezing?
Answer: Excel easily processes tens of thousands of transactions in registries, so in real work it is very difficult to encounter any restrictions in terms of the amount of data processed (especially in low-cost models).
Question: How are dependent items of various central financial districts filled out? Let's say transportation costs depend on revenue. Income and transportation costs are managed by different central federal districts.
Answer: To do this, you need to build a financial model of the company and describe in it all the relationships between such items. We will talk about building financial models in Excel in the third webinar of the series. Come, it will be interesting.
Question: The approach is good, but inconvenient for true planning. Those. we must ALREADY KNOW which numbers to enter into the register. And often you need to build a trend, take expenses as a percentage of something, etc. While? I often used building models with closed sheets, but open cells for input. What do you say?
Answer: You are confusing modeling and budgeting. A budget is a normative document, but this does not mean that you cannot use data calculated in financial models to fill it out. We will talk about financial modeling at the third webinar at the end of April.
Question: How to import actual transactions from 1C into Excel for variance analysis?
Answer: With the help of a loader, the work of which was demonstrated at the first webinar of the series, dedicated to management accounting and reporting. I encourage you to rewatch this webinar.
Question: Is the fact downloaded from the ERP system or entered manually?
Answer: Both options have a right to exist, but, of course, it is more effective to upload the fact using an automated procedure. An example of a loader was demonstrated in the first webinar. - When adding a new financial center, agreement, account or other analytics, does the macro need to be rewritten? No, the macro doesn't delve into analytics, it just copies rows. Just make sure that the number of registry entries being copied is correct.
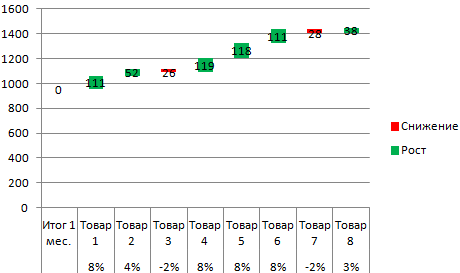
Question: How to get green and red triangles, please explain again.
Answer: You need to select the range of cells in which you want to use these icons, then call the menu command Home / Conditional Formatting / Manage Rules, in the dialog box that opens, click the “Create Rule” button, then select the “Icon Sets” format style, select specific icons in the “Icon Style” field (in addition to triangles, you can use circles, arrows, diamonds, crosses, zeros, etc.) and set specific numeric ranges corresponding to each icon.
Question: Should the costs of paying employees of the Central Federal District appear in the budget of this Central Federal District?
Answer: It depends on how you decide to proceed. In my opinion, all labor costs for all departments should be included in the budget of the financial service or personnel service.
Question: What is the role of the “Status” column?
Answer: This column is necessary so that in the register of actual transactions it is possible to record transactions that are only planned to be carried out. The essence of the column is that only transactions with the status “Fact” are included in management reporting, the rest are used for planning and approval of future payments (including monitoring their compliance with the budget).
Question: What about multi-user work when using such a model?
Answer: This model copes well with multi-user work; this is precisely why many files were created, each of which corresponds to a separate CFO. If all budgets were made by one person, then there would be no need to create a separate file for each central financial district.
Economists use this type of analysis in their work as plan-actual analysis. Otherwise it is called plan-factorial. Using this tool, you can calculate how close the planned values are to implementation, whether employees actually deviate from the given goal, and if so, why.
The tool is used in cases where it is necessary to monitor the implementation of the organization’s production and financial indicators by its management team. Any enterprise uses a software method of housekeeping; activities are not carried out by touch, at random. Planned values are sent to the structural unit or branch of the organization. They must conduct their activities in such a way as to fulfill the plan or exceed it. Thus, the forecast may reflect the following characteristics:
- quantity (weight) of goods produced;
- volume of services provided, work performed.
The extent to which a department or branch was able to achieve the specified values can be determined by analyzing the reporting documents.
There are annual reports on the income and expenses of the enterprise. It indicates how much of the product was actually sold during the specified period. Information about how much product and what type of product was produced during the same time is in the statistical reporting on the production of products and in accounting documentation, in particular in Form No. 16. It reflects the path of the product from release to sale. Information from the acquisitions book can also serve as a source of information.
The main way to determine the results of work is the comparative method. To do this, you need to take planned data and actual results. The formulas below will allow you to calculate two main indicators:
- how far the structural unit/branch has deviated from the plan: Δ = F-P, where F is the indicator of the actual deviation, and P is the plan;
- percentage indicator of achieving planned indicators: % = F/P*100.
Don't forget to take price inflation into account. In this case, the data on the cost of the actual goods produced must be adjusted. Then the above formulas will become a little more complicated and will look like this:
- Δi = Ф/I-П, where I is the price index. The formula will allow you to calculate how much the actual result deviated from the plan, taking into account the indexation of product costs.
- %i = (F/I)/P × 100- the formula allows you to calculate the percentage, taking into account the cost adjustment for inflation data.
In conditions of inflation, the cost indicator of the actual volume of production or sales is usually adjusted taking into account the price index.
Once it has been determined how well the plan and the fact correspond to each other, it is necessary to determine why this happened. This may be a consequence of the following circumstances:
- a batch of goods remained in the warehouse areas;
- low labor efficiency of workers;
- fulfillment of contract clauses;
- product range, etc.
This method of analytical work, such as plan-actual, is necessary for the main items of expenses and income. If you need to study why inconsistencies arose, then you need to analyze the operational and functional articles separately. It is possible to organize analysis for the entire enterprise and for its structural divisions. Be that as it may, the management of the organization independently determines what and when to analyze.
When using the plan-fact methodology, you must remember to format the indicators of the work result and the plan in the same form, otherwise it will not be entirely correct to compare information.
If any inconsistencies are identified, you can evaluate the performance of each link in the chain (supply department, production, logistics, personnel, etc.) in order to draw objective conclusions and take measures to correct the situation.
When analyzing, attention is paid to data that differs markedly from the planned numbers. There are external factors that structural divisions cannot influence:
- demand has fallen;
- Organizations owned by partners are closing.
In such cases, it is necessary to urgently adjust budget indicators so that they do not lead to the collapse of the enterprise. It is possible that we will have to refuse to purchase additional units and transfer employees to a different operating mode.
Once the deviations have been identified, the next step can be taken to evaluate the performance of the company as a whole or its joint venture.
An indicator for determining the justification of certain expenses is the final data of the budget, such as the size of the net cash flow. For example, inconsistencies in budget items can be analyzed in terms of how events will develop. If you calculate how this or that indicator that deviates from the plan will affect the amount of financial resources, it is possible to conclude that it is necessary to change the plan for the next quarter, half-year or year.
To analyze the variability of a trait under the influence of controlled variables, the dispersion method is used.
To study the relationship between values - the factorial method. Let's take a closer look at the analytical tools: factorial, dispersion and two-factor dispersion methods for assessing variability.
Analysis of Variance in Excel
Conventionally, the goal of the dispersion method can be formulated as follows: to isolate 3 partial variations from the general variability of the parameter:
- 1 – determined by the action of each of the studied values;
- 2 – dictated by the relationship between the studied values;
- 3 – random, dictated by all unaccounted for circumstances.
In Microsoft Excel, analysis of variance can be performed using the “Data Analysis” tool (the “Data” tab - “Analysis”). This is a spreadsheet add-on. If the add-in is not available, you need to open Excel Options and enable the Analysis setting.
The work begins with the design of the table. Rules:
- Each column should contain the values of one factor under study.
- Arrange the columns in ascending/descending order of the value of the parameter being studied.
Let's look at variance analysis in Excel using an example.
The company's psychologist analyzed the behavior strategies of employees in a conflict situation using a special technique. It is assumed that behavior is influenced by the level of education (1 – secondary, 2 – specialized secondary, 3 – higher).
Let's enter the data into an Excel table:


The significant parameter is filled in yellow. Since the P-Value between groups is greater than 1, Fisher's test cannot be considered significant. Consequently, behavior in a conflict situation does not depend on the level of education.
Factor analysis in Excel: example
Factorial analysis is a multidimensional analysis of relationships between the values of variables. Using this method you can solve the most important problems:
- comprehensively describe the object being measured (and succinctly, compactly);
- identify hidden variable values that determine the presence of linear statistical correlations;
- classify variables (identify relationships between them);
- reduce the number of required variables.
Let's look at an example of factor analysis. Let's say we know the sales of some goods over the last 4 months. It is necessary to analyze which titles are in demand and which are not.


Now you can clearly see which product sales are generating the main growth.
Two-way ANOVA in Excel
Shows how two factors influence the change in the value of a random variable. Let's look at two-factor analysis of variance in Excel using an example.
Task. A group of men and women were presented with sounds of different volumes: 1 – 10 dB, 2 – 30 dB, 3 – 50 dB. Response times were recorded in milliseconds. It is necessary to determine whether gender influences the response; Does volume affect response?
08.02.2015 02:54
The definition of “plan-actual analysis” is contained in its name - this is a comparison and study of planned and actual values of indicators, an explanation of deviations between them, and the formulation of conclusions. Simply put, it answers the question “why is there a difference and what to do about it?”
Obviously, for such an analysis you need to have at least three components: a) planned data; b) actual values; c) a subject who can explain everything. It is also obvious that the enterprise must have a budgeting system (or at least planning in its simplest form) and an accounting system. Those. It turns out that for such a seemingly simple task as plan-fact analysis, you already need to have a lot of things. The question is, is this necessary?
If the reader has the opinion that we want to convince of the uselessness of plan-fact analysis, then this is not so. Not at all like that! And this article is dedicated specifically to the importance of this kind of reporting. Plan-fact analysis is perhaps the simplest, but also one of the most useful.
Answering the question “why?”, the analyst analyzes the problem in detail. Deeply explores the causes and circumstances of “plan-fact” deviations, finds out the factors that led to them. This provides the basis for the main thing: to draw a conclusion and correct the situation if it is negative, and strengthen it if a positive effect is observed. This is the goal.
With a correctly constructed plan-fact analysis, dynamics are added to the static picture, i.e. changes in the indicators themselves and their deviations over time, from period to period. This is additional information, new ground for conclusions, enhancing their reliability.
Basically, the analysis under consideration relates to the management accounting system (since for preparation and analysis it is necessary to properly organize the collection and recording of information), but it can also be part of the budgeting system (since it is designed to analyze budgets, otherwise working with them will be not completed). We will not now delve into the issue of ownership and consider in detail the accounting and budgeting systems. Let us describe the main steps of organizing a plan-fact analysis, assuming that the company already has accounting and budgets.
- First of all, we define what we are analyzing. Those. What budget indicators do we need to look at deviations from and draw conclusions? These can be individual indicators (for example, KPI), and entire budget forms (for example, PL and CF).
- It is necessary to analyze the accounting system and determine what primary information will be useful for preparing a “fact” for the selected indicators. If the company does not have such information, then you need to start collecting it, or ask programmers to select it from databases, etc. sources. It is also important to identify the performers who will prepare the primary information.
- It is necessary to develop tables to fill out, come up with an algorithm and write down calculation formulas that will either help collect information or prepare its intermediate auxiliary form. Most likely, you will also have to prepare formulas for converting primary (and/or intermediate) information into actual information for budget indicators (i.e., consider the fact directly).
- It is important not to forget about the rules of interaction between participants in the process. This is a documentary confirmation of those responsible for the preparation of information, for the preparation of final actual indicators, in what form the information is transmitted, the timing of preparation and transmission, the deadlines for the readiness of all plan-fact reports, those responsible for writing comments on deviations, and end consumers. The regulations will become the document that will serve as the basis for the operation of the system.
- Testing. It is best to conduct testing in what is called “combat mode”, using real data. In this case, it will be possible to track not only “arithmetic” errors, but also logical and semantic ones. If for some reason this is not possible, then it would not be superfluous to test it on fictitious information - track down calculation errors, and the rest will be done during real operation.
- It is necessary to document the plan-fact analysis system just like any other system. This will give it a finished look and prevent the loss of the work done.
If you get the impression that we are overcomplicating “such a simple” question, then this is only to systematize it and give it a clear outline. In fact, even if in your company everything is done much simpler, this means that you do some issues without notice to yourself, as they say “in your mind.” This is possible as long as the volume of information being processed is not large. As your business grows, accounting can get confusing.
As mentioned above, plan-fact analysis occupies a borderline position between the budgeting and management accounting systems. Therefore, a natural desire would be to become familiar with the rules for constructing these systems. On the organization of the budgeting system And management accounting system articles have already been discussed earlier.
The company's divisions are carried out on the basis of coordination of activities at the horizontal level. At the same time, a single direction of planned activities, the commonality of goals of all elements of the company become possible within the framework of the vertical unity of divisions, i.e. unity within the management hierarchy (for example, the organization as a whole => product division shop O team), their integration.
The concept of an experiment with a model. Extreme and factorial experiment with the model. Testing and modification of the investment project based on the results of modeling and experiment. Optimal experimental designs.
These indicators are also used to assess the progressiveness of equipment. Park structure indicators are measured in fractions of a unit or as a percentage. In long-term planning, such indicators are calculated using a combination of the extrapolation method and the factorial method, as well as direct calculation based on the industry development plan.
Factorial - factors influencing a particular plan indicator are studied, and then the change due to each factor in the final indicator is calculated, for example, labor productivity depending on changes in production volume and the number of employees.
Index method - calculation of the influence of certain factors on plan indicators, but unlike the factor method, it operates with relative values.
The functioning of this block is based on the principle of dynamic addition. Specifically, it is embodied in the consistent enrichment of the system of accumulated knowledge about the mechanism of action of factors influencing product quality, based on production and research experience, generalization of the content of scientific publications, patents, projects, etc. In practical terms, the principle of dynamic addition means that there is always some (sometimes very large) gap between the achieved and potentially achievable level of quality. Gradually enriching the system of factor analysis of the quality level with experience, it is possible to achieve its systematic increase.
As another parameter of integration efficiency, it is necessary to use the following indicator - the relative economic effect, obtained as the ratio of the growth rate of profit to the growth rate of total costs of production and sales of products. Methods of a factorial approach to assessing the socio-economic efficiency of the formation of IHS are also proposed; here, social efficiency is determined taking into account factors of employment, growth in living standards, etc. A number of sources also consider parameters associated with savings on investments and inputs as integration effects. Thus, they believe that after the merger of capital there is no need to create new production facilities and develop infrastructure. Without disputing the importance of these parameters, it should be noted that the effects of the budget plan are strategic, such as, for example, the increase in national income and its attribution to the increase in the costs of living and materialized labor.
After this, you need to analyze the implementation of the plan according to the level of this indicator and establish the factors of its change (Fig. 11.2), for which the following factor model is used
The algorithm is based on the principle of decomposing the total deviation of the actual volume of production from the plan or the previous period into the sum of factor deviations
Method of splitting factor increments. In the analysis of economic activity, the most common problems are direct deterministic factor analysis. From an economic point of view, such tasks include analyzing the implementation of the plan or the dynamics of economic indicators, in which the quantitative value of the factors that influenced the change in the performance indicator is calculated. From a mathematical point of view, problems of direct deterministic factor analysis represent the study of the function of several variables.
Given in table. 13.27 calculations clearly show that the decrease in actual profit compared to the expected one was due to failure to fulfill the plan for the production of finished medicines, the occurrence of defects, and an increase in the share of general business expenses. However, significant reserves for increasing profits are hidden in improving the structure of products and the costs of their production, as well as in reducing the costs of servicing this production and administrative workshop costs. Similarly, a factor analysis of the profit received from the production of medicines in the ampoule workshop should be carried out, upon completion of which the calculation results should be summarized in the form of a set of reserves for increasing production profit (Table 13.28).
The advantage of this method is that when using it it is not necessary to calculate the level of factor indicators. It is enough to have data on the percentage of plan fulfillment for gross output, the number of workers and the number of days and hours they worked for the analyzed period.
The study of correlation relationships is of great importance in ACD. This is manifested in the fact that factor analysis is significantly deepened, the place and role of each factor in the formation of the level of the indicators under study is established, knowledge about the phenomena being studied is deepened, the patterns of their development are determined and, as a result, plans and management decisions are more accurately justified, the results of enterprises’ activities are assessed more objectively and on-farm reserves are more fully determined.
Due to the fact that the plan was underfulfilled for all factor indicators (Table 7.11), the level of profitability decreased by 2.09%.
A full factorial design assumes that experiments are carried out with all possible combinations of factors. For example, let us study the impact on sales of prices of two levels - 100 and 120 rubles. and advertising costs of two levels - 1000 and 2000 rubles. per day. Then the plan should include four experiments with the following combinations of price and expenses: 1) 100 rubles. and 1000 rub. per day 2) 100 rub. and 2000 rub. per day 3) 120 rub. and 1000 rub. per day 4) 120 rub. and 2000 rub. a day. Each experiment can be repeated the number of times necessary for a reliable assessment.
From the point of view of the characteristics of the enterprise for external users, as well as its top managers and functional managers, it is of greatest interest. Its definition is easiest to give by formulating the content of this scientific and practical direction. In terms of content, the analysis of the financial and economic activities of an enterprise is the purposeful activity of the analyst, which consists of identifying indicators, factors and algorithms and allowing, firstly, to give a certain formalized characteristic, factor explanation and/or justification of the facts of economic life as having taken place in the past, and those expected or planned for implementation in the future, and, secondly, systematize possible options for action. Let us give a brief description of the key terms of this definition.
Methods of elementary mathematics are used in ordinary traditional economic calculations when justifying resource needs, accounting for production costs, developing plans, projects, in balance sheet calculations, etc. The selection of methods of classical higher mathematics is due to the fact that they are used not only within the framework of other methods, for example, methods of mathematical statistics and mathematical programming, but also independently. Thus, factor analysis of changes in many economic indicators can be carried out using differentiation and integration.
It should be taken into account that the factor analysis technique is applicable both when analyzing profit indicators for the reporting period and when justifying the plan.
With the additive type of factor system, the influence of factor indicators on the resultant one is determined by direct calculation - by comparing the corresponding actual indicators with their basic value (in our example, with the plan).
Mathematically, the above block diagram of factor analysis of the deviation of the total value of ODA from the plan can be represented as follows. Let's say we are considering such an item of overhead costs as wages for service personnel. In this case, the distribution base is the wage fund of the main production personnel. Based on the results of the budget period, the enterprise’s accounting data for carrying out a plan-fact analysis of ODA deviations are as follows (see Table 28).
Scheme 38. Vertical factorial design-fact analysis of activity
As noted in paragraph 5.6 of Chapter 5, the adequacy of the choice of the distribution base for individual RPC items determines not only the reliability of the accounting data itself in terms of determining the full variable costs in the sale of certain types of products, but also the quality of the results and regulatory conclusions of the plan-fact analysis based on the results of the completed ( reporting) budget period. To illustrate this thesis, we will conduct a factor analysis for various variants of indicators chosen as the distribution base and compare the results obtained.
From the table 67 it follows that for all three products the deviation of the PKR for the reporting budget period was favorable (savings), and for product A there is both a deviation due to the distribution base and a deviation due to the distribution rate (both factor deviations are favorable). For products B and C, the favorable deviation of the PKR was achieved entirely due to the intensive factor (distribution rate) - the same sales volume as planned is ensured due to a smaller amount of direct selling expenses.
| Table 73, B is the final result of the vertical factor analysis of direct business expenses. It shows in a checkerboard form (in rows - distribution by , in columns - by type of product) the factor distribution of the total deviation of the actual value of the PKR from the plan. This double classification of deviations is due to the methodology of the analysis itself. |