Clapeyron's equation
When integrating the Clausius-Clapeyron equation in the very simple case the group is assumed to have a constant value that does not depend on temperature.
Denoting the constant value of integration by “A”, we obtain
Relationship (7.5) is sometimes called the Clapeyron equation. Graphically, the given dependence is expressed by a straight line. Often equation (7.5) turns out to be a good approximation, but in the general case it gives significant errors due to the fact that the dependence on has S-shaped appearance. Equation (7.5) is not applicable for temperatures below the normal boiling point, even for non-polar substances that are not prone to forming associates. For the latter, the linear form P-T dependencies can be used to approximate P-T data only in a narrow temperature range, even in the temperature range above the normal boiling point.
Antoine correlation for vapor pressure
Antoine proposed a widely used simple modification of equation (7.5):
At C=0, equation (7.6) turns into Clapeyron equation (7.5). The constants “A”, “B” and “C” in Antoine’s equation are obtained by approximating experimental P-T data. For many substances, the values of these constants are given in reference literature. The applicability of the Antoine equation constants is limited to those temperature or pressure ranges for which they are recommended by the authors of these reference books. Antoine's equation cannot be used outside the recommended intervals.
Cox-Antoine correlation for vapor pressure
Cox proposed a graphical correlation of vapor pressure. On the graph, the logarithm is plotted along the ordinate axis and a straight line (with a positive slope) is drawn, the ordinates of which correspond to the values of the vapor pressure of water (or some other reference substance). Since the dependence of water vapor pressure on temperature is well known, the abscissa is accordingly marked in temperature units. On the coordinate field prepared in this way, the vapor pressures of other substances will also be depicted by straight lines. However, such graphs are somewhat inconvenient for practical use due to the fact that interpolation by temperature turns out to be very inaccurate.
Kalingert and Davis showed that the temperature scale obtained in this way is almost equivalent to a function; here “C” is approximately equal to 43 K for most substances boiling at temperatures from 0 to 100 C. The same authors constructed the dependences of vapor pressures for a number of substances using the indicated method and obtained almost straight lines. Their equation
very similar to the Antoine equation, it is often called exactly that, and its graphical representation is considered a Cox diagram.
In the literature one can find indications that there are quite simple rules, relating the constant “C” to the normal boiling point of a substance. Although these rules are not very reliable, some of them are given below as an introduction to the approaches.
Thompson's Rules:
· for monoatomic and all substances with normal boiling point K
· for other connections
for substances normal temperature whose boiling point is above 250 K, it is recommended to take C = 43 K;
· for low-boiling gases C 0.
Another, more common form of Cox-Antoine correlation is obtained by differentiating equation (7.7) with respect to 1/T and combining the resulting relationship with the Clausius-Clapeyron equation (7.3). For the normal boiling point, the constants “A” and “B” are expressed in this case as follows:
Where P vp expressed in physical atmospheres.
To use equations (7.8), you only need to know at T b And T b. . In accordance with Miller's recommendation, ~ 1.05 can be taken for most substances in the low pressure region.
Construction of a phase equilibrium diagram of a binary mixture
1. Contents of the task:
Problem statement:
At pressure P, construct a phase equilibrium diagram for a given 2-component mixture using the following models: a) ideal mixture; b) Wilson; c) NRTL.
Given:
P, substances.
Build:
I schedule: T = f (x A); T = f (y A) – number of points N = 101 of the mixture according to the models: a) ideal mixture; b) Wilson; c) NRTL.
II schedule: y A = f (x A) – number of points N = 101. mixtures according to models: a) ideal mixture; b) Wilson; c) NRTL.
Task options:
|
Components |
Components |
||||||
Legend:
A– highly volatile component;
B– low-volatile component;
x i– content of the i-th component in the liquid phase, (mol.%);
y i– content of the i-th component in the vapor phase, (mol.%);
i– component index;
k i– phase equilibrium constant of the i-th component;
P– pressure in the system, ata;
P i– vapor pressure over a pure solvent, ata;
T– system temperature, °C
T balei– boiling point of the i-th component, °C
γ – activity coefficient
Λ ij, V i, λ ij– parameters of the Wilson model;
G ij, g ij– parameters of the NRLT model;
Mathematical model:
Stoichiometric ratio:
∑x i = 1; ∑y i = 1
Phase equilibrium:
Phase equilibrium constant:
Saturated vapor pressure of the i-th component:
![]()
Activity coefficients:
a) perfect mixture
b) according to Wilson
Note: the superscript is a square.
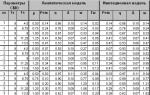
Reference data:
Antoine equation coefficient
V 1 = 104.00; V 2 = 49.60; V 3 = 18.70
a 12 = 0.30; a 13 = 0.20; a23 = 0.46
Calculation algorithm using the ideal mixture model:
1. Write down the coefficients Ai,B i ,C i Antoine's equations for a given pair of substances.
2. Find the boiling points of substances according to the “boiling point search algorithm” T bale at a given system pressure P” and determine from a pair of substances the highly volatile substance A and the highly volatile substance B.
3. Find the temperature step

4. We find T j at j = 1, … , N.
T 1 =T HT j +1 =T j +Δ T
5. For everyone T j we find P A And P B according to Antoine's equation.
6. For everyone T j we find K A And K B at γ = 1.
7. For everyone T j we find x A

8. For everyone T j we find y A.
9. We build graphs.
Calculation algorithm using Wilson models andNRLT:
items 1-7 are the same as in the “calculation algorithm using the ideal mixture model”
8. For x 1 =x A And x 2 = 1 –x A find the natural logarithms of the activity coefficients ln γ 1 and ln γ 2 according to the Wilson model or NRLT.
9. Finding activity coefficients γ 1 And γ 2 according to the Wilson model or NRLT.
10. For everyone T j we find K A And K B at γ 1 And γ 2, calculated in paragraph 9.
11. For everyone T j let's clarify x A
12. For everyone T j we find y A.
13. We build graphs.
Boiling point search algorithmT bale at system pressureP:
1. Set a custom temperature T.
2. Find P i of this substance at a given temperature T according to Antoine's equation.
3. If | P i – P|< 0.001, then T bale = T. If | P i – P| ≥ 0.001, then go to step 1, selecting T until the condition of step 3 is met.
2. Contents of the report:
Statement of the problem
Purpose of the work
Progress of work, with a description of calculations, the results of which are presented in the form of graphs;
3. Questions for control:
1) The main stages of constructing a mathematical description of mass transfer processes. What is the mathematical description of the mass transfer process based on?
2) Physical meaning of the phase equilibrium diagram. Heterogeneous and homogeneous systems. Dependence of phase equilibrium diagrams on pressure.
3) The fugacity of the component in the mixture, the activity coefficient of the component.
4) Wilson's equation (the concept of local compositions). NRTL equation (2 cell types).
I once made pancakes in a group of comrades, where there were teetotalers with ulcers. I’m lying, it seemed like there were no ulcers, but the teetotalers were special. Some flatly refused to consume ethyl alcohol in any form, even in the form of kefir. And arguments like the fact that the human body itself produces alcohol in some quantity did not pass. It produces, yes, but this is an unconscious (read irrational) process, and we, as the embodiment of rationality, do not want to add to it what we do not want to add.
Yes, I forgot to say, I wanted to cook pancakes not with anything, but with real beer - 5% of this very pentahydrodicarbonium hydroxide of ethyl alcohol.
I had to think about other rational arguments.
It was necessary to somehow demonstrate (read prove) the absence of alcohol in finished product.
Well, let's remember our youth.
The mass of a substance evaporated from any surface is calculated using the formula (we remember this; and everything is logical):
m = W * S * t, where
W - evaporation intensity,
S - surface area in m²,
t - time in s.
We know the mass (neglecting density): 0.5 kg 5% - 25 g = 0.025 kg of alcohol. But this is in the whole pancake mass. Considering that from the volume of dough that goes into one bottle of beer, I planned to get about 40 pancakes, which means that one pancake accounts for ~0.000625 kg of alcohol. A little. But digital techies require arguments only in the form of numbers, sometimes condescending to graphs and diagrams. Ok. Let's continue.
We also know the area of the evaporation surface - let’s take it as the area of the pancake (i.e. frying pan 22cm = 0.22m) = π*0.22² ~ 0.1521 m²
Now you need to find out the rate of evaporation of alcohol.
Here I had to go to the Internet, which reported that the evaporation rate is calculated as
W = 10⁻⁶ * n * √m * P,
where n is a coefficient taking into account the air flow speed environment(taken from tables). In this case, I decided to ignore it, in the sense of taking it as 1 (i.e. flow = 0 m/s).
m is the molecular weight of the substance. Oh, that's easy enough. C₂H₅OH - 46.07 g/mol (the Internet helped us here).
But P is the saturated vapor pressure of a substance at a specific temperature and is calculated using Antoine’s equation
logP = A-B/(C+T), where T is the design temperature, and A, B, C are the constants of the Antoine equation for the dependence of saturated vapor pressure on temperature.
Yoprsh. Normal people take such values from reference books, but as luck would have it, I didn’t have anything suitable on hand. And the Internet, the infection, was silent. Apparently I asked the wrong questions in the park...
But... the baking temperature of pancakes is clearly higher than the boiling point of alcohol (not to confuse which of them is doing what), and this cannot mean anything other than that the pressure of the evaporated substance is equal to the external pressure, i.e. let Antoine nervously smoke on the sidelines, we will take the data of standard atmospheric pressure - 100 kPa.
So, all the initial data is there. We count:
W = 10⁻⁶ * 1* √46.07 * 100 = 0.00068 kg/m²s
t = 0.000625 / (0.00068 * 0.1521) = 6.04 s
Get it. All the alcohol will evaporate from the pancake in less than 10 seconds.
The teetotalers had to check the calculations and grumble about the incorrectness of the method used (and the chemical activity of the substance was not taken into account and the calculations were supposedly carried out for pure substance etc.), but they still ate the pancakes. Q.E.D!