General structure of the ARIS methodology
http://rudocs.exdat.com/docs/index-62596.html?page=3
The ARIS eEPC notation stands for the following - extended Event Driven Process Chain - an extended event-driven process chain. The notation was developed by specialists from IDS Scheer AG (Germany), in particular Professor Scheer. The following table 2.3.1 shows the main objects used within the notation.
Table 2.3.1 Objects for describing business processes in ARIS eEPC notation.
In addition to the main objects listed in Table 2.3.1, many other objects can be used when constructing an eEPC diagram. In practice, using a large number of objects of different types is impractical, since this significantly increases the size of the model and makes it difficult to read. To understand the meaning eEPC notation Let's look at the main types of objects and connections used. In Figure 2.3.5. presented simplest model eEPC, which describes a fragment of an enterprise’s business process.
 Rice. 2.3.5. The simplest model in eEPC notation
From Figure 2.3.5. it is clear that the connections between objects have a certain meaning and reflect the sequence of functions within the process. An arrow connecting Event 1 and Function 1 “activates” or initiates the execution of Function 1. Function 1 “creates” Event 2 followed by an AND symbol “triggering” the execution of Function 2 and 3. A careful analysis of the eEPC notation shows that it is practically no different from the IDEF3 notation. The most important difference between eEPC is the presence of an “event” object. This object is used to display in the model the possible results of executing functions, depending on which one or another subsequent branch of the process is executed. The eEPC notation is obviously called extended precisely because it contains an “event” object - there is no such object in IDEF3. When building a model in ARIS eEPC, the following rules must be observed:
every function must be initiated by an event and must end with an event;
Each function cannot contain more than one arrow that “starts” the execution of the function, and no more than one arrow can exit that describes the completion of the function.
Figure 2.3.7 shows the use of various ARIS eEPC notation objects when creating a business process model.

Rice. 2.3.7. Using various objects when creating a model in eEPC notation
From Figures 2.3.6. and 2.3.7. It can be seen that a business process in eEPC notation is a sequence of procedures arranged in the order of their execution. It should be noted that the actual duration of procedures cannot be visually reflected in eEPC. This leads to the fact that when creating models, situations are possible when one performer will be assigned to perform two tasks simultaneously. The logic symbols used to build the model allow you to reflect the branching and merging of a business process. To obtain information about the actual duration of processes and visually display the workload of personnel in the process, you can use other description tools, for example, Gantt charts in the MS Project application.
In Figure 2.3.8. The business process of processing a customer order is presented. The process begins with the event “Customer order received.” This event initiates the “Post order in the system” function, which is performed by the Sales Department manager. He uses an “Order Accounting System” to complete the work. The result of the function execution is displayed by the “Order accounting completed” event. After this, the sales manager performs the “Perform product compliance analysis” function. The result of executing the function is two alternative events: “The order matches the item” and “The order does not match the item.” The process branches. To display the branching of a process, the logical exclusive "OR" symbol is used. The “Notify the customer about the impossibility of fulfilling the order” function can be performed in two cases: if the order does not correspond to the item, or production is impossible. To display these options on the process diagram, the logical “OR” symbol is used, etc. As can be seen from Figure 2.3.8., the process diagram in ARIS eEPC differs from the diagram in IDEF3 in the presence of objects: events, documents, application systems and positions. The diagram in ARIS is visually more informative and is perceived better, but the size of this diagram is significantly larger than the size of the diagram in the IDEF3 notation.  Rice. 2.3.8. An example of a process description in ARIS eEPC notation
chavalah June 13, 2012 at 2:19 pm
Using eEPC notation to graphically describe business processes
- GTD
Every thing is a form of manifestation of infinite diversity.
Kozma Prutkov
Introduction to eEPC notation
Currently, there are many different principles for graphically representing business processes, called notations. Why are there so many of them? This question has been asked by everyone who is faced with the need to describe business processes for decades. Let's look at the reasons. There are three of them (in my opinion):- Various tasks. Not all notations are equally convenient for solving various tasks. For example, a notation may be convenient for a top-level business process but not at all convenient for describing a workflow.
- There are different developers of such notations. IN different times Various developers tried to come up with new principles for describing circuits. They did this out of good intentions, when in practice they were faced with a situation where the notation they used could not reflect the necessary subtleties (or was not clear). Sometimes, in the process of evolution, such notations became, as it were, parallel, i.e. look different, but solve the same problems.
- The desire to stand out. This is when, for unknown reasons, a new notation suddenly appears, which has nothing outstanding in itself, but for some reason is promoted by its creator as the most perfect know-how. This still happens today.
The purpose of this article is not to consider all kinds of notations (I deliberately do not name their names), but to dwell on detailed description the notation that I chose for my projects during a long search for the most optimal option.
If anyone is interested in finding out what other notations there are and what they are used for, I plan to do this in another article, which will be called “Let's talk about notations,” but that’s in the plans for now.
It's time to start our story about the very interesting, simple and practical eEPC notation (translated: extended description of the event chain of processes). Its literal translation also reveals its main purpose: a description of the chain of business processes. The main “feature” of the notation is its “eventfulness” principle, which we will consider in detail.
What are the advantages of eEPC notation:
- Firstly, this is not quite a notation in its pure form. Those. if in some notations there is a strict set of elements and rules for their use (otherwise everything will get confused), then the eEPC principle allows you to add your own elements. How is this ensured? Of course, there is a certain “core” around which everything is built, i.e. a set of clear rules by which a diagram is constructed and by which it is then read. In addition, you can add your own element, include the rules for its use in your own corporate standard (to exclude amateur activities that can confuse the diagram and complicate its readability) and that’s it! This is very important point. In addition, you can set any other restrictions and rules in your corporate standard.
- eEPC contains logic elements. This allows you to build diagrams with conditions, which is necessary to describe the activity (“if the contract is agreed upon, then ...., otherwise ...”)
- The simplicity of the elements allows you to draw diagrams as in software products, and in any other way, even on paper, you will not get confused.
- eEPC is so easy to learn and understand that it can be used in real activities, and not just gathering dust in the closet. It will take about 2 hours to teach the rules (if the student wishes).
The main "core" of the eEPC notation
As I already mentioned, the literal translation of the eEPC acronym contains the concept of eventfulness. This is a very important point on which the entire principle of constructing the circuit is based. So, there are two key concepts: “Event” and “Function”. When someone first tries to draw their process in the form of an eEPC diagram, the question often arises, what is the difference between an event and a function? You need to clearly understand this, otherwise you will get an unpredictable result. So: an event is a fact of something happening, and it has no duration in time, or this time tends to zero (or does not matter). Moreover, an event always causes the need to execute a function, and the execution of a function always ends with an event. Let me explain with an example. The phone is ringing. The manager picked up the phone for a telephone conversation. In this case, “The phone rings” is an event. Telephone conversation is a function. The conversation is over (hung up) – another event. Thus, an event chain is observed: Call - conversation - end of call. And ending the call will probably require performing a new function: recording the result of the call, etc.Let's try to draw it. First, you need to figure out how the Event and Function elements are displayed.

These two simple elements form the basis of the rules for describing business processes in eEPC notation. I think I should say a few words about the colors used. If you came across descriptions of processes in other notations, as a rule they were black and white. And this is correct, there should not be an obvious dependence of the content on the color, because the diagram can be drawn with a pencil on paper, printed on a black-and-white printer, etc. In this case (in the eEPC ntation), it so happened historically that the elements have certain colors. Not to say that this is necessary, but a habit is developed, and the perception is electronic form better - you can immediately see what is what. These colors can be considered as a recommendation. Why are they like this? I’m not sure exactly, but it seems to me that because the ARIS company, when they made support for eEPC notation in their product, gave them these colors, they “took root.” By the way, sometimes this notation is also called “ARIS”, “ARIS EPC”, which is not entirely correct, because ARIS did not invent this notation, but supported it in its business process modeling program. In general, I recommend using colors. The main thing is that the shape of the elements itself should not be the same (i.e. differ only in color), because in black and white this can cause confusion. There are other rules that make it possible to make the eEPC diagram “harmonious”; we will talk about them.
So, there is an event, there is a function. How are they connected?
We see that event1 led to the need to perform a certain function that ended event2. If, for example, with a phone call, it would be like this:
The connection between event and function is usually displayed from top to bottom in one line or from left to right. The direction of the chain is indicated by connecting lines with arrows.
To make the diagram more visual, the notation provides several more standard elements:
- Job title(executor). The one who performs this function
- Information. Any information used to perform a function other than documentary information. For example, phone call, instructions for performing an operation, etc.
- Document. The “Document” element is intended to display information media (paper or electronic). Those. presentation of information in a specific structure.
- Program (application). The software used to perform the function.
All other elements are auxiliary and are practically not regulated by the requirements of the eEPC itself. However, there is no barrier to adding your own elements. The main thing is to fix this in an internal standard so that there is a common understanding of what they look like and why they are used. Such an extension does not violate the requirements if the event-function-event connection is not violated, and is intended only to improve the perception of information or adapt the description rules to any industry specifics. I added my own set of elements, which I will discuss below.
It is also necessary to find out how the considered elements should be located. All of these elements must be related to the function in one way or another. This general rule: No element other than a function is associated with the event. Those. all these elements must be connected by arrows to the function. As for the arrows and their directions: it is generally accepted that if there is no direction for transmitting information, then instead of an arrow, just a line is displayed. If information enters (enters the input), then the direction of the arrow is from the object to the function; if it comes out, then vice versa.
A few more words about the location of these elements on the diagram and we can redraw our diagram, clarifying the execution of the call processing function. There are no strict requirements for the arrangement of elements, but it is customary to display them equally on all diagrams (for uniformity and harmony of the diagram). To unify the external appearance of graphical diagrams of business processes, such rules must be enshrined in an internal standard and followed. A little later I will give some recommendations on this matter.
Now let's redraw our diagram:

We see that the operator processes an incoming call, acting in accordance with the rules for processing incoming calls and uses the CRM program for this. Neither incoming nor outgoing documents are used.
As I already mentioned, one of the strengths notations are elements of logic. At the same time, this is one of the most difficult moments to understand. Therefore, first I will give an example, and then we will separately deal with the elements of logic.
Let it be like this in our example: if the client is interested, further work with him is carried out by the sales manager and he sets commercial offer, which is sent by mail using the MS Outlook mail client. If there is no interest, then the call processing is completed. IN real life It would be nice to use the rules for ending a call, but that’s just me, by the way, let’s simplify it for now. Here's what happens: 
Logic elements in eEPC notation diagrams
The elements of logic are simple, but there are specific features and rules to ensure that the diagram is logical and unambiguously interpreted. The most important rule, which you need to adhere to 100%: logical decisions can only be made when performing functions ii. Those. after some event there can be no branching. Why? Because in this case it contradicts the very concept of an event - it is simple and instantaneous, without execution time. For example, if the phone rings and a person sits thinking about whether to pick up the phone or not, theoretically this will already be a function where he makes a decision. But in practice, including common sense, he violates the rules for processing calls, because... he is paid a salary to process these calls, and there is nothing to discuss here (in general, as shown in the diagram).In total, there are 3 different elements of logic:
- AND. When two or more events happen at the same time;
- OR. When one or more events can happen, but at least one thing must happen;
- EXCLUSIVE OR. Either one or the other. Those. two options are impossible at the same time.

As you can see, there are two options for graphical representation of logic elements. They are no different, completely alternative. I brought them both because... in practice, both options can be seen in various sources. Which one to use is up to you. I like the first one better.
Now you need to understand the use of logic elements. First, let's look at the options we encounter, then move on to an example. Let's look at each element separately.
Logic element "AND".
When a function requires multiple events to occur simultaneously:

Example: If the reporting period is closed (event 1) and the deadline for submitting a report to the manager has arrived (event 2), the employee prepares a monthly report.
Connecting elements if, when executing a function, several events occur:

Example: Some work has been completed with the customer. Two events were recorded at the same time: mutual settlements were reconciled (event 1), the act was signed (event 2).
In practice, this application does not occur often. As a rule, if many actions are combined in one function.
Connecting elements, if, when performing several functions, the event occurs:

Example: The storekeeper collected the order (function 1), the operator issued the documents (function 2), the goods are ready for shipment (event).
Connecting elements if the occurrence of one event leads to the execution of several functions:

Example: A shipment of goods has arrived (event). At the same time, the shipment of goods previously ordered by customers and the placement of the remaining goods in the warehouse begin.
Logic element "OR".
Connecting elements if one of the events can cause the function to be executed:
Example: An application was received by telephone (event 1) or an application was received by email(event 2) will lead to the need to process it.
Connecting elements if one function can raise at least one event:
Example: Prepared and sent the goods invoice for shipment to the client. The invoice could be sent by mail (event 1), by fax (event 2).
Connecting elements when executing multiple functions will trigger an event:

Example: A service is provided (function 1) or a product is sold (function 2), and a debt arises from the client (event 1).
Logical element "EXCLUSIVE OR".
A connection of elements when one and only one of the events is necessary to perform a function:

Example: The customer came to the store in person (event 1) or made an order via the Internet (event 2). It is necessary to ship the goods (function 1).
Connecting elements if, as a result of executing the function, at most one of the following events occurs:

Example: The decision is either made or not.
Connection of elements, if withthe event will occur after one and only one of the functions has been performed.

Example: The goods were delivered (event 1) either by our own transport (Function 1), or transport company(function 2)
Correct application of logic elements requires some practice. But it's not difficult. It should be noted that not all combinations considered are widely used in practice (and in general this is determined by the analyst’s way of thinking).
Try to apply the elements of logic in practice. If you have any difficulties, write to me, I will try to help.
Extending the notation with your own elements
As I already said, eEPC is not exactly a notation, but rather rules of description. And these rules do not prohibit adding your own elements to the diagram. The main thing is that these elements are understandable, and that there is a document where such expansions of elements are recorded. For example, I use the following additional elements, which arose gradually in the process of describing real processes for various tasks, from simple description to setting tasks for automation.
Data file. Used if an operation results in a data file being created, or a file is used to perform an operation.
Database. Used to describe information flows between automated systems.
Card index. Used to display a paper file or archive.
Material flow.
Used to indicate incoming and outgoing material flows, as well as resources consumed during the execution of a process. The material flow is displayed to the left of the accompanying documents.
Information cluster. Used to denote structured information (entity representation). The diagram can be used to indicate documents generated programmatically when using user applications. In this case, the Cluster element is located to the left of the corresponding document. Those. indicates that the user not only created a paper document, but also created a copy of it in the program.
Agreements on the rules for placing figures on a diagram
The eEPC notation itself does not impose strict requirements on the arrangement of elements relative to each other, although it is customary to draw a diagram from top to bottom or from left to right. If this is not unified in the case of the work of several specialists, then a kind of “vinaigrette” may result. To avoid this, it is recommended to develop and approve your own rules for the arrangement of elements.- The sequence of events and functions is arranged from top to bottom (better) or left to right (if there is not enough space);
- Elements indicating performers are located to the right of the functions;
- Incoming documents are at the top left of the functions; arrow direction from documents to functions;
- Outgoing documents at the bottom left of the functions; arrow direction from function to documents;
- The Information element is located at the bottom right of the function. If there is not enough space, an arbitrary location is allowed, as close as possible to the function;
- The Application element is located at the top right of the functions. (if file storages that are not reports are used for this, they are displayed similarly). Link without arrow.
- The “Database” and “Card Index” elements are arranged randomly;
- The “Material Flow” element is located to the left of the documents accompanying it and is linked to the document by a line without an arrow;
- The “Cluster” element, when used in combination with the “Document” figure to designate a document in electronic form, is located to the left of the corresponding document.

Identifying Elements in a Diagram
As you know, a competent approach to describing business processes involves their identification, i.e. when each process has its own code name. Accordingly, individual functions within a process also have their own names and identifiers.
The figures “Document” and “Function” are required to be identified on the diagram.
The document is identified by indicating in the upper left corner the code of the report or document in accordance with the registry. Documents received from suppliers of goods and services (incoming) are identified only by name.
A function is identified by specifying the function sequence number for a given process group. Those. The function number always begins with the process group code. Issues of identifying process groups are beyond the scope of this article; we will consider them separately. Moreover, you should learn to identify processes before you begin to describe them, otherwise there may be a desire to describe all the company’s activities on one diagram, as is sometimes attempted.
Therefore, now I will only show with an example how this can be represented in the diagram. Let's return to the call processing example. Let’s assume that we assigned the code “04” to the sales department, and the code “VK” to the incoming contact processing process. Then the diagram will take the following form (identification is highlighted in red for clarity). The document code indicates the serial number of the document in the general register of documents (we will also consider this separately when we get to examining the document flow system). 
Feedback display
When building models, there is often a need to perform a process cyclically according to some condition or the need to display the activities of decision makers. In this case we are talking about feedback.
To display control feedback, the principle of “direct inclusion” in the process is used additional function control with subsequent branching (using the “Exclusive OR” logical element). For example:
Text description of processes
No matter how hard we try to display a business process on a diagram, we will not be able to achieve complete detail, otherwise we can get bogged down in endless chains of elements and conditions. To avoid this, as well as to add information to the process description that cannot be displayed graphically, the description is supplemented with text accompaniment. For this purpose, various text templates are developed, which are filled in during the description process. The forms of such templates can be different and include separate sections describing inputs and outputs, resources consumed, used software etc.
In the simplest case, a business process description template might look like this:
| Business process: | Processing an incoming contact | 04.VK |
| Process functions: |
||
| Name | Description | Number on the diagram |
| Processing an incoming call | When an incoming call arrives, the operator processes the call in accordance with the rules for processing incoming calls. Reveals client interest and provides information about services | 04.VK.01 |
| Formation of a commercial offer | If the client is interested, the operator transfers the contact to the sales manager. The sales manager prepares a commercial proposal and sends it to the client by email | 04.VK.02 |
| Process indicators: |
||
| Name | Method of evaluation/measurement | |
| Number of failures | Database statistics | |
Beyond the scope of this article are such important topics as collecting information, identifying business processes, decomposition, and identifying indicators. We will definitely study these issues in future issues.
The ARIS EPC notation, used to model business processes in the ARIS toolkit, is a sequence of events and functions that reflect the logic of performing interrelated actions aimed at achieving a certain result.
The ARIS EPC model is intended to describe the algorithm for executing a business process in the form of a sequence of event-driven functions. The ARIS EPC model focuses on the sequence of functions, and to describe the conditions in the business process model, events and rules are used, which can describe complex algorithms for executing a business process.
Functions in the ARIS EPC model are triggered by events, for example, “Invoice received for approval,” and end with events, for example, “Invoice is approved” or “Invoice is not approved.” If, as a result of executing a function, there is only one option for further execution of the business process, i.e. As a result, only one event is generated, after which the next function comes; the event between these functions may not be drawn.
A business process model of ARIS EPC notation necessarily begins and ends with one or more events or interfaces to other business process models. To reflect interfaces, special objects “Process Interface” are used - the object type “Function”.
When creating an ARIS EPC model, situations may arise where the same document is an outgoing document for one function and an incoming document for the next. In these cases, to improve the ergonomics of the model, it is permissible to use one document representation with one incoming connection (from the function in which it is created or adjusted) and one outgoing connection (to the function in which it is used).
The EPC model cannot be disconnected, i.e. placing on the model one object that is not connected to the others is an error.
The location of documents relative to functions is usually as follows: on the top left are incoming documents, on the bottom left are outgoing documents, performers are usually located to the right of the function.
The following information is indicated on the ARIS EPC model:
- functions performed
- information resources of functions (incoming/outgoing documents)
- events
- process interfaces
- logical operators
- performers (positions, business roles)
- information systems
Event naming rules in ARIS EPC
The event name must contain a noun and a verbal description of the state change. Example: “Transaction completed.”
Function naming rules in ARIS EPC
To name a function, you must use its real name. The name must consist of two parts - a verbal noun describing the function performed, and a noun indicating the object on which it is performed. The function name consists of the short name of the object starting with a capital letter, for example, “Search for customer contacts.”
Rules for naming roles/positions in ARIS EPC
The name of the business role (Person Type) must correspond to the essence of the responsibilities assigned to the performer. As a rule, the title contains the phrase “Responsible for...”. Job titles (Position) are written in accordance with the staffing table.
Document Naming Rules
The object corresponds to a document (Information Carrier) (in paper and/or electronic form). To name documents (regardless of the symbol used), you must use their real name.
Rules for naming information systems in ARIS EPC
For the name information systems(Application system type) their established names should be used.
Process interface naming rules
The Process interface shows a link to an adjacent process. The name of the process interface corresponds to the name of the model that describes the adjacent part of the business process. The interface can be used to reference business process models that are not part of the business process being described.
In this section we will look at the ARIS methodology. Currently on the market tools modeling business processes ARIS software of the same name is presented.
The ARIS methodology includes several different notations to describe the activities of an organization from different perspectives. The methodology integrates existing standards and specifications for describing processes and data, for example IDEF3, ERD, DFD, UML, etc. The basic concept of ARIS for describing an organization is shown in Fig. 2.30.
Image in Fig. 2.30 is often called the "ARIS house". The ARIS methodology approach to describing processes is based on considering the activities of an organization from four points of view: a view of the organizational structure, a view of data (flows and structure), a view of functions (functional hierarchies), a view of control and management (summary models of business processes) .
The ARIS methodology includes large number various notations allowing flexible creation of various models
organizations. The most significant and practically used ARIS notations include: Value-added Chain Diagram notation (value-adding process chain diagram); eEPC, Extended Event-driven Process Chain and PCD notations; Organizational Chart notation; Function Tree notation; Product Tree notation.
Rice. 2.30. Main types of models in the ARIS methodology
The strength of the ARIS methodology (from a formal point of view) lies in its complexity, which is manifested in the interconnection of models built in different notations. The ARIS methodology allows you to describe the activities of an organization from different points of view, and the resulting models are interconnected to a certain extent. It should, however, be emphasized that the main advantages of such integrated approach: for their implementation, they require the presence of the ARIS tool environment, which is expensive and quite difficult to use, although there is a free, simplified version of this product called ARIS Express;
are difficult to implement in practice, as they entail a large consumption of resources (human, material and financial) over a long period of time. Value-added Chain Diagram (VAD) notation
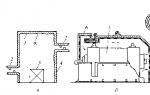
In Fig. Figure 2.31 presents one of the most important ARIS notations - the Value-added Chain Diagram notation. A value-adding process chain diagram is used to describe an organization's business processes at the top level. As a rule, consultants using ARIS recommend identifying six to eight top-level business processes and describing them in VAD notation. Then the resulting top-level processes are decomposed, using either the VAD or eEPC notation. Let's consider the main objects of the VAD notation, presented in Fig. 2.31.
The main object of VAD notation is the Value Added Chain. In fact, it is a process or group of functions of an organization that serves to generate added value. Objects are connected to each other by a dotted arrow of type is predecessor of (“is a predecessor”). This type of communication shows that one process is the predecessor of another. It is obvious, however, that in practice all basic processes are cyclical. In addition, they have feedback links. Therefore, the term is predecessor of, in our opinion, is unfortunate.
Between the processes shown in Fig. 2.31, flows of material resources and information can be displayed. To describe them, you can use objects of the Cluster type (to describe information) and Technical Term (to describe material flows). To describe the infrastructure required to perform a process, in in this example the Product/Service and Information Service object types are selected. The choice of object types for displaying real flows is quite arbitrary. It is very important at the beginning of process modeling work to determine exactly what types of objects will be used and what real-world objects they will represent. So, in the example in Fig. 2.31, it would be possible to show all flows (information and material) using objects of the Technical Term type.
Rice. 2.31. Model in Value-added Chain Diagram notation 
In Fig. Figure 2.31 also shows Organizational Unit objects that display the organizational units that perform the corresponding processes.
Objects are connected to each other using connections of a certain type (Fig. 2.31). For example, the information flow displayed by the Cluster object is input to the first process, and it is associated with it using an arrow of type is input for. Another example is the executes relationship type between Value-added Chain and Organizational Unit objects. The type of connection is used by shows that Product/Service is used by a process, etc. Thus, in the ARIS methodology, the most important requirements are the correct selection and further use of connections and objects of a certain type.
In Fig. Figure 2.32 shows an example of a top-level model, executed in the ARIS VAD notation. You are already familiar with this process. In Fig. 2.17 it is given in IDEF0 notation.
The principles of constructing a top-level process diagram in VAD differ significantly from IDEF0: in VAD, arrows can enter any side of the Value-added Chain object. (Recall that in IDEF0, each side of the Activity object (function) has a deep meaning.)
3 ![]()
 ABOUT
ABOUT
§
ABOUT
ABOUT
In Fig. Figure 2.33 presents a situation that is possible in the VAD notation, when the process diagram shows many feedbacks, the meaning of which is understandable only to the analyst who created the model.
This disadvantage of VAD can be circumvented by stipulating in advance the possibility of special use of feedback links, as, for example, in Fig. 2.34.
Rice. 2.33. Feedbacks in Value-added Chain Diagram notation 
Rice. 2.34. An example of implementing feedback connections in the Value added Chain Diagram notation 
Note that this approach may cause criticism among ARIS specialists, since it contradicts the notation. But we stick
from the point of view that this is quite acceptable, since the top-level models in the VAD ARIS notation can really only be used as the simplest way to graphically depict a process chain.
Concluding the review of the ARIS VAD notation, we once again emphasize that the specified notation in to a greater extent This is for illustrative purposes only and is not intended to create comprehensive models of top-level processes in an organization. ARIS eEPC notation - extension of IDEF3 notation
The ARIS eEPC notation (eEPC - Extended Event Driven Process Chain - an extended event-driven process chain) was developed by specialists German company IDS Scheer AG (Germany), in particular by Professor Scheer. In table 2.3 shows the main objects used within the notation.
In addition to those indicated in the table. 2.3 main objects, many others can be used when constructing an eEPC diagram. In practice, using a large number of objects of different types is impractical, since this significantly increases the size of the model and makes it difficult to read.
To understand the meaning of the eEPC notation, let's consider the main types of objects and relationships used. In Fig. Figure 2.35 presents the simplest eERS model, which describes a fragment of an enterprise’s business process.
In Fig. Figure 2.35 shows that the connections between objects have a certain meaning and reflect the sequence of functions within the process. The arrow connecting event 1 and function 1 activates or initiates the execution of function 1. Function 1 creates event 2, followed by an AND symbol that initiates the execution of functions 2 and 3.
A careful analysis of the eEPC notation shows that it is practically no different from IDEF3. The most important difference between eERS is the presence of an “Event” object. This object serves to display in the model the possible results of the implementation of functions, depending on which one or another subsequent
process branch. The eEPC notation is called extended, obviously, precisely because of the presence of the “Event” object in it (there is no such object in IDEF3). In Fig. 2.36 provides examples of the use of logic and event symbols when constructing models in the eEPC notation.
Table 2.3. The main objects used within the ARIS eEPC notation
| № | Naimenova-. niv | Description | ¦Graphic performance |
||
| />1 | Function | The “function” object is used to describe the functions (procedures, works) performed by departments/employees of the enterprise | | * "" H Function J | |
| 2 | Event | The “event” object is used to describe the real states of the system that influence and control the execution of functions | |
||
| 3 | Organizational unit | An object reflecting various organizational units of an enterprise (for example, management or department) | | ija^^tionaUi^it |
|
| 4 | Document | An object that represents real-life storage media, such as a paper document | | Document | |
| 5 | Applied system | The object reflects the real application system used within the function execution technology | A | I¦ yplication systjs J? M | m |
| | |
||||
| 6 | Information cluster | An object characterizes data as a set of entities and relationships between them. Used to create data models | | | |
| 7 | Arrow connection between objects | An object describes the type of relationship between other objects, such as the activation of a function by some event | gt; |
||
| 8 | Boolean "AND" | | © |
||
| 9 | Boolean "OR" | A logical operator that defines relationships between events and functions within a process. Allows you to describe process branching | @ |
||
| 10 | Boolean exclusive "OR" | A logical operator that defines relationships between events and functions within a process. Allows you to describe process branching | ® |
||
Rice. 2.35. ARIS eEPC notation 
Rice. 2.36. The use of logical operators when building models in eERS 
When building a model in ARIS eEPC, the following rules must be observed: each function is initiated and completed by an event; Each function cannot contain more than one arrow that starts the function's execution, and cannot leave more than one arrow that describes the end of the function's execution.
In addition to these, there are other important rules for forming models in ARIS.
In Fig. Figure 2.37 shows the use of various objects of the ARIS eEPC notation when creating a business process model.


J activates  alt="" />

 In Fig. 2.36 and 2.37 it is clear that a business process in the eEPC notation is a sequence of procedures arranged in the order of their execution. It should be noted that the actual duration of procedures in the eEPS cannot be reflected visually. This leads to the fact that when creating models, situations are possible when one performer is assigned to perform two tasks simultaneously. The logic symbols used to build the model allow you to reflect the branching and merging of a business process. To obtain information about the actual duration of processes and visually display the workload of personnel, you can use other description tools, for example, Gantt charts in the MS Project system.
Let's look at examples of using the eEPC notation to describe business processes.
In Fig. Figure 2.38 shows the process of processing a customer order (it is also depicted in IDEF3 notation in Fig. 2.24).
The process begins with the event “Customer order received.” It initiates the function “Perform order accounting in the system”, which is carried out by the sales department manager. For work, he uses the “Order Accounting System”. The result of the function execution is displayed by the “Order accounting completed” event.
After this, the sales manager implements the “Perform analysis for item compliance” function. The result is two alternative events: “The order matches the item” and “The order does not match the item.” The process branches. To display the branching of a process, the logical exclusive "OR" symbol is used.
The “Notify the customer about the impossibility of fulfilling the order” function can be performed in two cases: if the order does not correspond to the item or production is impossible. To display these options on the process diagram, the logical “OR” symbol is used, etc.
As can be seen from Fig. 2.38, the process diagram in ARIS eERS differs from the diagram in IDEF3 in the presence of objects: events, documents, application systems and positions. The diagram in ARIS is visually more informative and is perceived better, but its size is significantly larger than the diagram in the IDEF3 notation.
The process discussed above can also be presented in the ARIS PCD (Process Chain Diagram) notation - a type of eEPC. In Fig. Figure 2.39 presents the business process of processing a client’s application in PCD notation. Its description uses the same objects that make up the process in Fig. 2.38, but they are arranged in table form. In the first column - events and some symbols of logic, in the second - functions, in the third - incoming and outgoing documents, in the fourth - types of application software, in the fifth - positions involved in the process. This representation of the process is more common. It is better suited for documenting processes.


However, the PCD notation has a significant drawback - it can be effectively used for simple (no more than five to eight functions), preferably linear processes. Complex processes with branched logic are inconvenient to display using PCD, which is clearly shown in Fig. 2.39.
Rice. 2.39. ARIS PCD diagram 
ARIS Organizational Chart Notation
Organizational Chart notation is one of the main ARIS notations and is intended for constructing diagrams organizational structure enterprises. Typically, this model is built at the beginning of a business process modeling project. The model reflects the existing divisions of the enterprise in the form of a hierarchical structure, as shown in Fig. 2.40.
Rice. 2.40. Enterprise organizational structure model
alt="" />
The model is built from the objects Organizational Unit, Position, Internal Person, etc. The types of connections included in the notation allow you to reflect various types relationships between objects of the organizational structure. In the one shown in Fig. In the example in 2.40, “Enterprise” is managed by “Director”, and the connection type is Organization Manager for. The hierarchy of departments is built using links is composed of. Positions can also be indicated - Position, the names of the employees occupying them - Internal person, type of connection - occupies. In addition to department hierarchy models, subordination hierarchy models can be built in project teams, groups, etc. All objects reflected in the models can be used in the future when building business process models. When constructing complex hierarchical
decomposition of structures can be used, for example, the structure of a department is reflected in a more detailed diagram. ARIS Function Tree Notation
This notation is intended for forming function tree models. An example of such a model is shown in Fig. 2.41. All functions in this diagram are connected by links. The most commonly used connection types are execution-oriented superior and is process-oriented superior. The first type of connection is used to build a tree according to a functional characteristic (description of the functions of a department). The second type of connection is used when creating a tree of functions included in a certain business process.
Rice. 2.41. Function Tree Model
The function tree can be built according to functional, process and product principles. In practice, the first principle is often used - models of the hierarchy of department functions are created. ARIS Product Tree Notation
In Fig. Figure 2.42 shows the ARIS Product Tree notation. It is intended for creating product tree models. Models of this type can be used to describe the material inputs and outputs of a process.
Rice. 2.42. Product Tree Model
ARIS Information Flow Notation
Information Flow notation is an analogue of DFD and is used when constructing data or document flow diagrams between the functions of enterprise business processes. The simplicity of the notation limits its useful applications. Its main objects are Function (also used when building business process models) and Information Flow - information flow, as shown in Fig. 2.43.
Rice. 2.43. ARIS Information Flow Notation
information flow
When building business process models, an eERS model can first be built, and then, using the functions defined in the process, an information flow model. Using multiple notations when creating process models in ARIS
When forming business process models in ARIS, as a rule, several types of notations are used. In Fig. Figure 2.44 shows a diagram of the use of models created in various notations.
Rice. 2.44. Using ARIS notations when creating models
As a rule, work on describing a company's business processes in ARIS begins with creating a model of the organizational structure. At the same time (or later), models can be developed that describe the structure of the main material and information inputs and outputs. Using these models, top-level business process models are created in VAD notation. After this, models of department functions and other auxiliary models (for example, a description of application software systems) are developed. Then process models are formed in the eEPC notation. eERS models are built on the basis of existing descriptions of the organizational structure, functions of departments, materials, systems, etc. The result of the work is a set of models that describe the activities of the organization from various points of view.
The peculiarity of working in full-fledged software products for modeling business processes is that the software product creates a database of objects and their attributes. With one
On the other hand, this allows you to consider various aspects of the interaction of model objects by choosing one of the notations (Fig. 2.44). On the other hand, a “minor” error when creating connections between objects in one notation can significantly distort the appearance of the diagram in another notation.
Every thing is a form of manifestation of infinite diversity.
Kozma Prutkov
Introduction to eEPC notation
Currently, there are many different principles for graphically representing business processes, called notations. Why are there so many of them? This question has been asked by everyone who is faced with the need to describe business processes for decades. Let's look at the reasons. There are three of them (in my opinion):- Various tasks. Not all notations are equally convenient for solving various problems. For example, a notation may be convenient for a top-level business process but not at all convenient for describing a workflow.
- There are different developers of such notations. At different times, different developers tried to come up with new principles for describing circuits. They did this out of good intentions, when in practice they were faced with a situation where the notation they used could not reflect the necessary subtleties (or was not clear). Sometimes, in the process of evolution, such notations became, as it were, parallel, i.e. look different, but solve the same problems.
- The desire to stand out. This is when, for unknown reasons, a new notation suddenly appears, which has nothing outstanding in itself, but for some reason is promoted by its creator as the most perfect know-how. This still happens today.
The purpose of this article is not to consider all kinds of notations (I deliberately do not name their names), but to dwell on a detailed description of the notation that I chose for my projects in the process of a long search for the most optimal option.
If anyone is interested in finding out what other notations there are and what they are used for, I plan to do this in another article, which will be called “Let's talk about notations,” but that’s in the plans for now.
It's time to start our story about the very interesting, simple and practical eEPC notation (translated: extended description of the event chain of processes). Its literal translation also reveals its main purpose: a description of the chain of business processes. The main “feature” of the notation is its “eventfulness” principle, which we will consider in detail.
What are the advantages of eEPC notation:
- Firstly, this is not quite a notation in its pure form. Those. if in some notations there is a strict set of elements and rules for their use (otherwise everything will get confused), then the eEPC principle allows you to add your own elements. How is this ensured? Of course, there is a certain “core” around which everything is built, i.e. a set of clear rules by which a diagram is constructed and by which it is then read. In addition, you can add your own element, include the rules for its use in your own corporate standard (to exclude amateur activities that can confuse the diagram and complicate its readability) and that’s it! This is a very important point. In addition, you can set any other restrictions and rules in your corporate standard.
- eEPC contains logic elements. This allows you to build diagrams with conditions, which is necessary to describe the activity (“if the contract is agreed upon, then ...., otherwise ...”)
- The simplicity of the elements allows you to draw diagrams both in software and in any other way, even on paper, you will not get confused.
- eEPC is so easy to learn and understand that it can be used in real activities, and not just gathering dust in the closet. It will take about 2 hours to teach the rules (if the student wishes).
The main "core" of the eEPC notation
As I already mentioned, the literal translation of the eEPC acronym contains the concept of eventfulness. This is a very important point on which the entire principle of constructing the circuit is based. So, there are two key concepts: “Event” and “Function”. When someone first tries to draw their process in the form of an eEPC diagram, the question often arises, what is the difference between an event and a function? You need to clearly understand this, otherwise you will get an unpredictable result. So: an event is a fact of something happening, and it has no duration in time, or this time tends to zero (or does not matter). Moreover, an event always causes the need to execute a function, and the execution of a function always ends with an event. Let me explain with an example. The phone is ringing. The manager picked up the phone for a telephone conversation. In this case, “The phone rings” is an event. Telephone conversation is a function. The conversation is over (hung up) – another event. Thus, an event chain is observed: Call - conversation - end of call. And ending the call will probably require performing a new function: recording the result of the call, etc.Let's try to draw it. First, you need to figure out how the Event and Function elements are displayed.
These two simple elements form the basis of the rules for describing business processes in eEPC notation. I think I should say a few words about the colors used. If you came across descriptions of processes in other notations, as a rule they were black and white. And this is correct, there should not be an obvious dependence of the content on the color, because the diagram can be drawn with a pencil on paper, printed on a black-and-white printer, etc. In this case (in the eEPC ntation), it so happened historically that the elements have certain colors. Not to say that this is necessary, but the habit is developed, and the perception in electronic form is better - you can immediately see what is what. These colors can be considered as a recommendation. Why are they like this? I’m not sure exactly, but it seems to me that because the ARIS company, when they made support for eEPC notation in their product, gave them these colors, they “took root.” By the way, sometimes this notation is also called “ARIS”, “ARIS EPC”, which is not entirely correct, because ARIS did not invent this notation, but supported it in its business process modeling program. In general, I recommend using colors. The main thing is that the shape of the elements itself should not be the same (i.e. differ only in color), because in black and white this can cause confusion. There are other rules that make it possible to make the eEPC diagram “harmonious”; we will talk about them.
So, there is an event, there is a function. How are they connected?
We see that event1 led to the need to perform a certain function that ended event2. If, for example, with a phone call, it would be like this:
The connection between event and function is usually displayed from top to bottom in one line or from left to right. The direction of the chain is indicated by connecting lines with arrows.
To make the diagram more visual, the notation provides several more standard elements:
- Job title(executor). The one who performs this function
- Information. Any information used to perform a function other than documentary information. For example, a telephone call, instructions for performing an operation, etc.
- Document. The “Document” element is intended to display information media (paper or electronic). Those. presentation of information in a specific structure.
- Program (application). The software used to perform the function.
All other elements are auxiliary and are practically not regulated by the requirements of the eEPC itself. However, there is no barrier to adding your own elements. The main thing is to fix this in an internal standard so that there is a common understanding of what they look like and why they are used. Such an extension does not violate the requirements if the event-function-event connection is not violated, and is intended only to improve the perception of information or adapt the description rules to any industry specifics. I added my own set of elements, which I will discuss below.
It is also necessary to find out how the considered elements should be located. All of these elements must be related to the function in one way or another. This is a general rule: no element other than a function is associated with an event. Those. all these elements must be connected by arrows to the function. As for the arrows and their directions: it is generally accepted that if there is no direction for transmitting information, then instead of an arrow, just a line is displayed. If information enters (enters the input), then the direction of the arrow is from the object to the function; if it comes out, then vice versa.
A few more words about the location of these elements on the diagram and we can redraw our diagram, clarifying the execution of the call processing function. There are no strict requirements for the arrangement of elements, but it is customary to display them equally on all diagrams (for uniformity and harmony of the diagram). To unify the external appearance of graphical diagrams of business processes, such rules must be enshrined in an internal standard and followed. A little later I will give some recommendations on this matter.
Now let's redraw our diagram:
We see that the operator processes an incoming call, acting in accordance with the rules for processing incoming calls and uses the CRM program for this. Neither incoming nor outgoing documents are used.
As I already mentioned, one of the strengths of notation is its elements of logic. At the same time, this is one of the most difficult moments to understand. Therefore, first I will give an example, and then we will separately deal with the elements of logic.
In our example, let it be like this: if the client is interested, the sales manager carries out further work with him and puts forward a commercial offer, which he sends by mail using the MS Outlook email client. If there is no interest, then the call processing is completed. In real life, it would be nice to use the rules for ending a call, but that’s just me, by the way, let’s simplify it for now. Here's what happens:
Logic elements in eEPC notation diagrams
The elements of logic are simple, but there are specific features and rules to ensure that the diagram is logical and unambiguously interpreted. The most important rule that you need to adhere to 100%: logical decisions can only be made when performing functions ii. Those. after some event there can be no branching. Why? Because in this case it contradicts the very concept of an event - it is simple and instantaneous, without execution time. For example, if the phone rings and a person sits thinking about whether to pick up the phone or not, theoretically this will already be a function where he makes a decision. But in practice, including common sense, he violates the rules for processing calls, because... he is paid a salary to process these calls, and there is nothing to discuss here (in general, as shown in the diagram).In total, there are 3 different elements of logic:
- AND. When two or more events happen at the same time;
- OR. When one or more events can happen, but at least one thing must happen;
- EXCLUSIVE OR. Either one or the other. Those. two options are impossible at the same time.
As you can see, there are two options for graphical representation of logic elements. They are no different, completely alternative. I brought them both because... in practice, both options can be seen in various sources. Which one to use is up to you. I like the first one better.
Now you need to understand the use of logic elements. First, let's look at the options we encounter, then move on to an example. Let's look at each element separately.
Logic element "AND".
When a function requires multiple events to occur simultaneously:
Example: If the reporting period is closed (event 1) and the deadline for submitting a report to the manager has arrived (event 2), the employee prepares a monthly report.
Connecting elements if, when executing a function, several events occur:
Example: Some work has been completed with the customer. Two events were recorded at the same time: mutual settlements were reconciled (event 1), the act was signed (event 2).
In practice, this application does not occur often. As a rule, if many actions are combined in one function.
Connecting elements, if, when performing several functions, the event occurs:
Example: The storekeeper collected the order (function 1), the operator issued the documents (function 2), the goods are ready for shipment (event).
Connecting elements if the occurrence of one event leads to the execution of several functions:
Example: A shipment of goods has arrived (event). At the same time, the shipment of goods previously ordered by customers and the placement of the remaining goods in the warehouse begin.
Logic element "OR".
Connecting elements if one of the events can cause the function to be executed:
Example: An application was received by telephone (event 1) or an application was received by email (event 2) will result in the need to process it.
Connecting elements if one function can raise at least one event:
Example: Prepared and sent the goods invoice for shipment to the client. The invoice could be sent by mail (event 1), by fax (event 2).
Connecting elements when executing multiple functions will trigger an event:
Example: A service is provided (function 1) or a product is sold (function 2), and a debt arises from the client (event 1).
Logical element "EXCLUSIVE OR".
A connection of elements when one and only one of the events is necessary to perform a function:
Example: The customer came to the store in person (event 1) or made an order via the Internet (event 2). It is necessary to ship the goods (function 1).
Connecting elements if, as a result of executing the function, at most one of the following events occurs:
Example: The decision is either made or not.
Connection of elements, if withthe event will occur after one and only one of the functions has been performed.
Example: The goods were delivered (event 1) either by our own transport (Function 1) or by a transport company (function 2)
Correct application of logic elements requires some practice. But it's not difficult. It should be noted that not all combinations considered are widely used in practice (and in general this is determined by the analyst’s way of thinking).
Try to apply the elements of logic in practice. If you have any difficulties, write to me, I will try to help.
Extending the notation with your own elements
As I already said, eEPC is not exactly a notation, but rather rules of description. And these rules do not prohibit adding your own elements to the diagram. The main thing is that these elements are understandable, and that there is a document where such expansions of elements are recorded. For example, I use the following additional elements, which arose gradually in the process of describing real processes for various tasks, from simple description to setting tasks for automation.
Data file. Used if an operation results in a data file being created, or a file is used to perform an operation.
Database. Used to describe information flows between automated systems.
Card index. Used to display a paper file or archive.
Material flow. Used to indicate incoming and outgoing material flows, as well as resources consumed during the execution of a process. The material flow is displayed to the left of the accompanying documents.
Information cluster. Used to denote structured information (entity representation). The diagram can be used to indicate documents generated programmatically when using user applications. In this case, the Cluster element is located to the left of the corresponding document. Those. indicates that the user not only created a paper document, but also created a copy of it in the program.
Agreements on the rules for placing figures on a diagram
The eEPC notation itself does not impose strict requirements on the arrangement of elements relative to each other, although it is customary to draw a diagram from top to bottom or from left to right. If this is not unified in the case of the work of several specialists, then a kind of “vinaigrette” may result. To avoid this, it is recommended to develop and approve your own rules for the arrangement of elements.- The sequence of events and functions is arranged from top to bottom (better) or left to right (if there is not enough space);
- Elements indicating performers are located to the right of the functions;
- Incoming documents are at the top left of the functions; arrow direction from documents to functions;
- Outgoing documents at the bottom left of the functions; arrow direction from function to documents;
- The Information element is located at the bottom right of the function. If there is not enough space, an arbitrary location is allowed, as close as possible to the function;
- The Application element is located at the top right of the functions. (if file storages that are not reports are used for this, they are displayed similarly). Link without arrow.
- The “Database” and “Card Index” elements are arranged randomly;
- The “Material Flow” element is located to the left of the documents accompanying it and is linked to the document by a line without an arrow;
- The “Cluster” element, when used in combination with the “Document” figure to designate a document in electronic form, is located to the left of the corresponding document.
Identifying Elements in a Diagram
As you know, a competent approach to describing business processes involves their identification, i.e. when each process has its own code name. Accordingly, individual functions within a process also have their own names and identifiers.
The figures “Document” and “Function” are required to be identified on the diagram.
The document is identified by indicating in the upper left corner the code of the report or document in accordance with the registry. Documents received from suppliers of goods and services (incoming) are identified only by name.
A function is identified by specifying the function sequence number for a given process group. Those. The function number always begins with the process group code. Issues of identifying process groups are beyond the scope of this article; we will consider them separately. Moreover, you should learn to identify processes before you begin to describe them, otherwise there may be a desire to describe all the company’s activities on one diagram, as is sometimes attempted.
Therefore, now I will only show with an example how this can be represented in the diagram. Let's return to the call processing example. Let’s assume that we assigned the code “04” to the sales department, and the code “VK” to the incoming contact processing process. Then the diagram will take the following form (identification is highlighted in red for clarity). The document code indicates the serial number of the document in the general register of documents (we will also consider this separately when we get to examining the document flow system).
Feedback display
When building models, there is often a need to perform a process cyclically according to some condition or the need to display the activities of decision makers. In this case we are talking about feedback.
To display control feedback, the principle of “direct inclusion” of an additional control function in the process with subsequent branching is used (the “Exclusive OR” logical element is used). For example:
Text description of processes
No matter how hard we try to display a business process on a diagram, we will not be able to achieve complete detail, otherwise we can get bogged down in endless chains of elements and conditions. To avoid this, as well as to add information to the process description that cannot be displayed graphically, the description is supplemented with text accompaniment. For this purpose, various text templates are developed, which are filled in during the description process. The forms of such templates can be different and include separate sections describing inputs and outputs, resources consumed, software used, etc.
In the simplest case, a business process description template might look like this:
| Business process: | Processing an incoming contact | 04.VK |
| Process functions: |
||
| Name | Description | Number on the diagram |
| Processing an incoming call | When an incoming call arrives, the operator processes the call in accordance with the rules for processing incoming calls. Reveals client interest and provides information about services | 04.VK.01 |
| Formation of a commercial offer | If the client is interested, the operator transfers the contact to the sales manager. The sales manager prepares a commercial proposal and sends it to the client by email | 04.VK.02 |
| Process indicators: |
||
| Name | Method of evaluation/measurement | |
| Number of failures | Database statistics | |
Beyond the scope of this article are such important topics as collecting information, identifying business processes, decomposition, and identifying indicators. We will definitely study these issues in future issues.