Let's consider return on equity enterprises. Let's dive deeper into the analysis of two ratios that determine return on equity: return on equity(ROE) return on capital employed(ROCE).
Determination of return on equity and employed capital ratios
Return on equity ratio (Return On Equity, ROE) shows how effectively your own funds were invested in the enterprise.
Return on capital employed ratio(Return On Capital Employed, ROCE) shows the effectiveness of investing both own and borrowed funds in an enterprise. The indicator reflects how effectively the enterprise uses in its activities equity and long-term attracted funds (investments).
To understand return on equity, we will analyze and compare the two ratios ROE and ROCE. In comparison, the differences between one and the other will be visible. The scheme for analyzing two return on capital ratios will be as follows: consider economic essence coefficients, calculation formulas, standards and we will calculate them for a domestic enterprise.
Return on Equity. Economic essence
The return on capital employed (ROCE) ratio is used in practice by financial analysts to determine the return that a company generates on its invested capital (both equity and borrowed capital).
What is it for? In order to be able to compare the calculated profitability ratio with other types of business to justify the investment of funds.
Return on total capital. Comparison of indicatorsROE AndROCE
| ROE | ROCE | |
| Who uses this ratio? | Owners | Investors + owners |
| Key differences | Own capital is used as investment in the enterprise | Both own and attracted capital (through shares) are used to invest in an enterprise. In addition, we must not forget to subtract dividends from net profit. |
| Calculation formula | =Net profit/Equity | =(Net profit)/(Equity + Long-term liabilities) |
| Standard | Maximization | Maximization |
| Industry to use | Any | Any |
| Frequency of evaluation | Annually | Annually |
| Accuracy of enterprise finance assessment | Less | More |
To better understand the difference between return on equity ratios, remember that if the company does not have preferred shares (long-term liabilities), then the value of ROCE = ROE.
How to read return on equity?
If the return on equity ratio (ROE or ROCE) decreases, this indicates that:
- Equity increases (as well as debt for ROCE).
- Asset turnover decreases.
If the return on equity ratio (ROE or ROCE) is growing, then this indicates that:
- The profit of the enterprise increases.
- Increases financial leverage.
Return on Equity. Synonyms of odds
Let's consider synonyms for return on equity and return on capital employed, because They are often called differently in the literature. It is useful to know all the names to avoid confusion in terms.
| Synonyms for return on equity (ROE) | Synonyms for return on capital employed (ROCE) |
| return on equity | return on capital attracted |
| Return on Equity | return on equity |
| Return on shareholders’ equity | return on ordinary share capital |
| equity efficiency | capital employed ratio |
| Return on owners equity | Return on capital Employed |
| return on capital invested |
The figure below shows the accuracy of assessing the state of the enterprise using various coefficients.
The ratio of capital employed (ROCE) is useful for analyzing businesses where there is a high capital intensity (investment is frequent). This is due to the fact that the capital employed ratio uses raised funds in its calculation. Applying the ratio of capital employed (ROCE) allows us to make a more accurate conclusion about financial results companies.
Return on Equity. Calculation formulas
Calculation formulas for return on equity.
Return on equity ratio = Net profit/Equity =
page 2400/page 1300
Capital employed ratio = Net profit / (Equity + Long-term liabilities) =
p.2400/(p.1300+p.1400)
In the foreign version, the formula for return on equity and return on capital employed will be as follows:


Net Income - net profit,
Preferred Dividends – dividends on preferred shares,
Total Stockholder Equity – the amount of ordinary share capital.
Another foreign formula (according to IFRS) for return on capital employed:
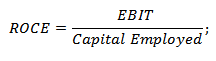
Often, foreign sources use EBIT (earnings before interest and taxes) in the ROCE calculation formula; in Russian practice, net profit is often used.
Video lesson: “Return on invested capital”
Profitability capital. Calculation using the example of Mechel OJSC
In order to understand even better what return on capital is, let’s consider the calculation of its two coefficients for a domestic enterprise.
To estimate the return on equity capital of Mechel OJSC, we will take it from the official website financial statements for four periods of 2013 and calculate the ROE and ROCE indicators.

Return on equity for Mechel OJSC-1

Return on capital for Mechel OJSC-2
Return on capital of Mechel OJSC
Return on equity ratio 2013-1 = -3564433/126519889 = -0.02
Return on equity ratio 2013-2 = -6367166/123710218 = -0.05
Return on equity ratio 2013-3 = -10038210/120039174 = -0.08
Return on equity ratio 2013-4 = -27803306/102274079 = -0.27
Return on capital employed ratio 2013-1 = -3564433/(126519889+71106076) = -0.01
Return on capital employed ratio 2013-2 = -6367166/(123710218+95542388) = -0.02
Return on capital employed ratio 2013-3 = -10038210/(120039174+90327678) = -0.04
Return on capital employed ratio 2013-4 = -27803306/(102274079+89957848) = -0.14
I didn’t choose the example of a company’s balance sheet very well, since profitability for all periods was less than 0, which indicates the inefficiency of the company. However, the general calculation for return on equity ratios is clear. If we had income, then the ratio of these two ratios would be as follows: ROE>ROCE. If we also consider the enterprise's return on assets (ROA) in relation to return on capital ratios, then the inequality will be as follows: ROA>ROCE>ROA.
An enterprise can be considered as a potential investment target when ROCE (and, accordingly, ROE) > risk-free/low-risk investments (for example, bank deposits).
Summary
So we looked at return on equity. It involves calculating two ratios: return on equity (ROE) and return on capital employed (ROCE). Return on equity is one of the key indicators the efficiency of the enterprise along with such ratios as: return on assets and return on sales. You can read more about the return on sales ratio in the article: ““. These ratios are useful for business owners and investors to calculate in order to find a suitable investment property.
Return on total capital.
Shows how much profit the company earns per ruble of total capital invested in its assets. Return on equity closes the entire pyramid of company performance indicators.
At the same time, all the company’s activities should be aimed at increasing the amount of equity capital and increasing its level of profitability.
It is easy to see that return on equity (ROE) and return on total capital (ROA) are closely related:
Where MK- capital multiplier (financial leverage).
This relationship shows the relationship between the degree financial risk and return on equity. Obviously, as the return on total capital decreases, the company must increase the degree of financial risk in order to achieve the desired level of return on equity.
Return on equity.
Shows that it can depend not only on business profits, but also on the ratio of debt and equity capital. This relationship is commonly called the leverage effect. Its essence is very simple: the company uses borrowed funds, to increase or decrease return on equity. There is a decrease in return on equity, the main reason for which is a decrease in sales profitability. Interpretation of the above dynamics of return on assets allows the company's management to draw the following conclusion: if in 2008 for every ruble own funds the company brought an average of 11.17 rubles of profit, then in 2013, each ruble of its own funds “earns” the company 76 rubles. And this is a good symptom of the company’s activities.
It can also be noted here that important characteristic the effectiveness of a company's activities when analyzing return on equity capital is a direct comparison of the characteristics of the profitability of its assets and equity capital. This comparison often shows the level of skill financial management companies.
Altman index. When adapted to the conditions of the Russian economy, this formula looks like:
where VB is the balance sheet currency (total assets);
VR - sales revenue for the period;
ZK - borrowed capital;
MC - authorized capital;
TA - current assets;
NK - accumulated capital;
AML - profit from core activities, p.
A company's ability to repay obligations in the long term is determined by the ratio of its own and borrowed funds and their structure. You can also use the method of analyzing financial ratios, solvency, liquidity, the Lees method, the Taffler method, etc.
However, it is better to use the Altman model, which takes into account these financial results in a comprehensive manner, showing the company’s distance from bankruptcy.
For the LSR company, the Altman indicator shows, although a low result, but one that is consistently not worsening.
Company market share. This is a percentage of the total volume target audience, covered by the company. Market share is also called the percentage of sales of a particular company in total volume sales of a certain product by all competing companies in a particular market. Market share is one of the most important indicators of a company's performance and an indicator of the results of competition. Market share demonstrates a certain ability of LSR to influence supply and demand in the market. Although certain marketing activities would not hurt to improve the position on this indicator.
DEFINITION
Return on total capital is an indicator that reflects the profitability of an enterprise when it uses investments in its assets.
All investments can be formed from two sources: equity capital and borrowed capital. For this reason, there are two coefficients by which return on total capital is determined:
- return on equity (ROE),
- return on borrowed capital (ROCE).
The return on capital owned by an organization reflects the effectiveness of investing funds in the functioning of the company.
The return on employed (borrowed) capital formula reflects the effectiveness of investments in the organization's work, both own and borrowed funds. Using this indicator, management can determine the degree of efficiency in the use of equity capital and raised funds in its activities in the long term (for example, investments).
Return on Total Capital Formula
The formula for return on total capital (assets, total funds) is determined by the ratio of book profit to the value of all assets of the enterprise. Using this formula, the return that falls on each ruble of assets is recorded.
The return on total capital can be modified if the value of net profit is placed in the numerator instead of book profit. In this case, we get the net return on total capital:
Rsk= PE / SK * 100%
Here Rsk is the return on capital indicator (%),
PE – net profit (rub.),
SC – total cost of capital (rub.).
All profitability values are determined as a percentage.
If in the calculation process we use financial statements, then the formula for return on total capital will take the following form:
Rsk = line 2300 / line 1600
Here line 2300 is the amount of profit before tax from the income statement,
Line 1600 – the amount of the enterprise’s assets according to the balance sheet.
Return on total capital value
The value of return on total capital is influenced by the size of profit, as well as the ratio between liabilities and own resources. This ratio can be determined by the ratio of liabilities to capital (the “financial leverage” of the enterprise).
In the process of increasing obligations and increasing costs of servicing them, the company's management thus reduces profits and profitability.
The return on total capital formula is used in the capital comparison process:
- with similar indicators of other enterprises,
- with interest on bank deposits and the yield of government securities.
If the return on capital is less than the interest on the deposit (bonds) for the same time period, then investing in the project will not make sense. The optimal excess of profitability over these indicators is several times.
Examples of problem solving
EXAMPLE 1
| Exercise | Calculate return on total capital using the example of two operating periods. The company has the following performance indicators in the current and previous reporting periods: Amount of profit before tax 1 – 45500 rub., 2 – 42230 rub., Income tax 1 – 12225 rub., 2 – 12211 rub., Total capital amount 1 – 383,500 rub., 2 – 381,000 rub. |
| Solution | Let's calculate the amount of net profit for these periods, subtracting income tax from the profit: 1st period of emergency = 45500-12225 = 33275 rub. 2nd period of emergency =42230-12211=30019 rub. The profitability indicator can be calculated using the following formula: Rsk= PE / SK * 100% Rsk(1)= 33275/ 383500 * 100%=8.68% Rsk (2)= 30019/ 381000 * 100%=7.88% Conclusion. We see that the change in return on total equity was -0.8 (7.88% - 8.68%). |
| Answer | Rsk (1) = 8.68%, Rsk (2) = 7.88% |
ROTA is a coefficient equal to the ratio of net profit to the amount of assets. Calculation data contains Balance sheet And Financial results report(formerly Income Statement). This is a generalized indicator of profitability, reflecting the amount of profit per unit of capital cost (all financial resources of the organization, regardless of sources of financing).
Return on total assets calculated and analyzed in the FinEkAnalysis program in the Analysis and assessment of profitability and profitability block as Return on Total Assets.
Return on total assets - what it shows
Return on total assets(ROTA) characterizes the degree of efficiency of use of the organization’s property, professional qualifications enterprise management.
Return on Total Assets - Formula
General formula for calculating the coefficient:
Data calculation formula balance sheet:
where line 2300 is the line of the Financial Results Report (form No. 2), line 1600 is the line of the Balance Sheet (form No. 1) at the beginning and end of the year.
Return on total assets - value
Indicator growth Return on total assets linked:
- with an increase in the organization’s net profit,
- with an increase in tariffs on goods and services or a decrease in costs for the production of goods and services,
- with an increase in asset turnover.
The decrease is due to:
- with a decrease in the organization’s net profit,
- with an increase in the value of fixed assets, current and non-current assets,
- with a decrease in asset turnover.
Was the page helpful?
More found about return on total assets
- On the standard values of coefficients when forming a rating assessment of the financial and economic condition of an enterprise Ra Efficiency of use of total assets Pc Ba Return on equity on net profit Rk Efficiency of use of equity capital
- Assessment of the financial performance of mergers and acquisitions of TNK-BP Holding are used more effectively than the average of industry companies, with the return on total assets of TNK-BP Holding OJSC being 4 times greater than the industry value and 3
- The influence of IFRS on the results of the analysis of the financial position of PJSC Rostelecom In the next group - various data on profitability 26 return on total assets non-current capital working capital equity capital sales During the study, conventional methods were used
- Forecasting the bankruptcy of enterprises in the transport industry It can be noted that the final model included indicators of the absolute liquidity ratio, receivables repayment period, operating cycle, ratio current assets to total assets return on costs indicator of the ratio of receivables to total assets and ratio
- Methodology for analyzing the consolidation of a cash flow statement Cash return on total assets % 7.87 15.15 Net cash return on invested capital gross % 4.86 9.57
- Comprehensive analysis of the financial condition of an educational organization Table 15 Profitability of activities educational organization in 2012, 2013 No. p Indicator 2012 2013 Absolute... Average annual value of total assets at residual value 932,018.7 1,049,672.9 117,654.2 112.6 2 Average annual
- Directions for analyzing the financial condition of an organization in relation to management goals and user needs Net profit Total assets 13 10 Return on equity Net profit Own capital 31 24 Profitability of non-current assets
- Such different goodwill: testing of various methods for assessing a company’s goodwill and interpretation of the results obtained RCA - return on total assets TA - cost of total assets w - share of equity in the structure
- Models for predicting bankruptcy of enterprises in the construction industry and the agricultural industry Secondly, it is worth noting that return on assets is an indicator of the ratio of receivables to total assets, security of own working capital, cost-effectiveness, liquidity in the mobilization of funds are universal when
- Average annual balance sheet value of all assets thousand rubles 2135268 2259015.5 123747.5 3 Return on total assets % -4.788 34.878 39.666 4. Income tax expense thousand rubles
- Analysis of financial condition in dynamics Deviation 2014 from 2010 Return on total assets 0.002 0.009 0.071 -0.057 0.336 0.334 Efficiency of non-working capital 0.012 0.04 0.306
- Analysis of financial assets according to consolidated statements According to the statement of movements Money the intensity of transactions with financial assets is analyzed. Based on the statement of comprehensive income and notes to the consolidated statements, efficiency is assessed
- Justification of financial decisions in managing the capital structure of small organizations At the top of the diagram is the indicator of return on total assets ROA, based on two factor coefficients - return on sales ROS and resource efficiency
- Financial ratios Return on total assets Return on net assets Return on debt capital Return on working capital Gross profitability Return on investment
- Assessment of the financial position of the enterprise and determination of the optimal model for the probability of bankruptcy of the enterprise Indicator of the ratio of accounts receivable to total assets K8% - Dynamics of changes in return on assets K9% - - -
- Analysis of the financial condition of an individual Indicator of the ratio of receivables to total assets. Return on assets. Net profit rate Considering that the Debtor is an individual
- A study of the influence of internal factors on the capital structure at different stages of the life cycle of Russian companies Taking into account the Russian specifics of lending to small and medium-sized businesses, it is often difficult for companies to obtain a loan at a rate lower than the generated profitability in order to successfully develop and grow in the future Another researcher in this area of corporate finance N... In addition, the scientist notes that for the creditor the risks are reduced when the company prefers tangible assets to intangible assets as collateral since the former have a greater liquidation value in the event of bankruptcy Hypothesis 2 In... Great Britain being at the maturity stage in the period 2001-2011 and came to the conclusion that the fact that profit and return on total capital have a significant impact on the choice of capital structure. Researchers also noted that independence from
- Empirical study of capital structure factors: analysis of companies in the Volga Federal District Capital and reserves to total assets for 2010 ROS - return on sales by profit from sales Kvar sates
- Key aspects of managing the profit of an organization The following groups of profitability indicators can be distinguished: return on assets with detailing into non-current current and net assets return on capital of total equity debt return on sales return on expenses When calculating profitability indicators of OJSC
- Working capital management policy in the holding company Return on assets or total capital ratio English ge-| turn on assets ROA is the ratio of net profit
There is a fairly wide list of indicators necessary to calculate the effectiveness of an organization. The main share in this group is occupied by different kinds profitability. They are necessary for a more complete and objective analysis performance results.
What is profitability in simple words
Most often, it reflects how many kopecks of a particular type of profit an organization can receive by investing one ruble in production. And in the case of sales efficiency indicator, profitability shows the share of profit in revenue.
What types, indicators, profitability ratios exist
It is customary to distinguish several groups of indicators - production, sales, capital. In each category, 3-4 values are calculated. It cannot be said that all indicators are equivalent and you can take only one from the group.
In order to evaluate efficiency, it is necessary to use the entire set of types of profitability.
Return on assets
They use profit before tax and reflect how effectively the organization’s fixed assets are used and show how much profit a ruble of fixed and working capital or the total assets of the enterprise:
- fixed assets (ROFA – return on fixed assets);
- working capital (ROFA – return on currency assets);
- assets (ROA – return on assets).
The basic earning power ratio (BEP) characterizes how much a company needs to earn to cover all costs.
Production and sales profitability
They are calculated on the basis of profit from sales and show the effectiveness of the main activities of the organization:
- products (ROM – return on margin) characterizes how much profit from sales can be obtained from one ruble, taken into account in the cost of manufactured products;
- sales (ROS – return on sales) reflects the share of profit from sales in the total income of the enterprise;
- personnel (ROL – return on labor) describes how much profit the company will receive from the operation and employment of employees.
Return on Equity
Net profit is taken as a basis and characterizes the efficiency of using capital for the company’s activities. Also, this subgroup can be calculated during planning and allows you to assess whether it is profitable to invest or borrow:
- equity (ROE – return on equity) reflects the efficiency of using own funds in the activities of the enterprise;
- invested, permanent capital (ROIC – return on invested capital) shows how many kopecks of net profit the organization will receive by investing one ruble in investments;
- borrowed capital (ROBC – return on borrowed capital) describes the feasibility of taking out a loan. If the indicator is higher than the cost of borrowed funds, then it is profitable to take them, if lower, then the organization will suffer losses.
Video - 12 main profitability ratios:
How to calculate profitability
IN general view The profitability formula is the ratio of profit to part of the enterprise’s property, revenue or cost:
Profitability = Profit / Indicator whose profitability needs to be found
For example, if the efficiency of fixed capital is needed, then the numerator will be the profit from sales, and the denominator will be the average cost of fixed assets. In the case of, revenue is substituted into the denominator as an indicator of sales.
Return on assets is usually found by book profit, production and sales - by profit from sales, capital - by net profit.
Data for calculation are taken from the balance sheet and income statement.
General formulas for calculating profitability
Assets:
ROFA = BN/C VNA, Where
ROFA – return on non-current assets,
C vna – average cost of non-current assets, rub.;
ROCA = BN/C both, Where
ROCA – return on working capital;
BN – profit before tax, rub.;
C both – average cost of mobile assets, rub.;
ROA = BN / C vna + C both, Where
ROA – return on assets;
BN – profit before tax, rub.;
C vna + C both – average amount of fixed and current assets, rub.
Production and sales:
 ROM = PR / TC, Where
ROM – profitability of products;
PR – profit from sales, rub.;
TC – total cost;
ROS = PR / TR, Where
ROS – return on sales;
TR – sales revenue, rub.
ROL = PR / SSCH, Where
ROL – personnel profitability;
PR – profit from core activities, rub.;
SSN – average number of personnel.
Capital:
ROE = PE / SK, Where
ROE – return on equity;
PE – net profit, rub.;
SK – equity capital, rub.;
ROBC = PE/ZK, Where
ROBC – return on debt capital;
ZK – borrowed capital;
ROIC = PE / SK + DO, Where
ROIC – return on invested (fixed) capital;
PE – net profit, rub.;
SK + DO – the sum of equity and long-term debt, rub.
Example of calculation by balance
The company Ekran LLC ended the period with the following financial indicators. It is necessary to display the effectiveness of the organization's activities for 2014. Average headcount staff 25 people. The amount of equity capital is 120,000 rubles.
| Indicator name | Code | As of December 31, 2013 | As of December 31, 2014 | |
| ASSETS | ||||
| I. NON-CURRENT ASSETS | ||||
| Total for Section I | 1100 | 100000 | 150000 | |
| II. CURRENT ASSETS | ||||
| Total for Section II | 1200 | 50000 | 60000 | |
| PASSIVE | ||||
| III. CAPITAL AND RESERVES 6 | ||||
| Retained earnings (uncovered loss) | 1370 | 20000 | 40000 | |
| IV. LONG TERM DUTIES | 1410 | |||
| Borrowed funds | 10000 | 15000 | ||
Calculation of return on assets:
ROFA = 48,000 / (100,000 + 150,000)/2 = 0.384
ROCA = 48,000 / (50,000 + 60,000)/2 = 0.87
ROA = 48,000 / (125,000 + 55,000) = 0.26
Calculation of profitability of production and sales:
ROM = 50,000 / 25,000 = 0.5
ROS = 50,000 / 75,000 = 0.67
ROL = 50,000 / 25 = 2,000
Calculation of return on capital:
ROE = 40,000 / 120,000 = 0.3
ROBC = 40,000 / 15,000 = 2.66
ROIC = 40,000 / 120,000 + 15,000 = 0.296
Conclusions from the calculations in the example:
For existing production all indicators are at normal levels. It is obvious that it is profitable to use borrowed funds, employees work efficiently, and the amount of working capital is optimal. It is worth paying attention to fixed capital; there is a possibility that it is not fully exploited or there are reasons that reduce the performance of non-current assets.
It is also advisable to analyze the situation with a large amount of equity capital, which reduces the overall efficiency of the enterprise. Given current indicators, it is rational to use and restructure equity capital.
In what cases is its calculation useful?
The indicator is necessary for qualitative assessment efficiency of the enterprise. Absolute indicators such as profit and cost do not provide a true picture of an organization's performance.
They only show the effect of production. Profitability, in its turn, allows you to assess how well and fully the company’s property and resources are used. It shows how much money can be obtained from the operation of one or another type of own or borrowed funds.
All types of profitability are important for assessing the effectiveness of an organization. Like other relative indicators, they allow not only to analyze the activities of a given enterprise, but also to compare it with competing companies.
Profitability, calculated over several years, reflects the dynamics of performance and can become the basis for medium- and long-term planning. Special attention it is necessary to pay attention to the profitability of fixed assets, since they occupy a fairly large share of the organization’s property and are often used inefficiently.
Video about profitability and profitability: